Pipelines
This page describes how to create and configure pipelines in the kdb Insights Enterprise user interface.
The kdb Insights Stream Processor is a stream processing service for transforming, validating, processing, enriching and analyzing real-time data in context. It is used for building data-driven analytics and closed loop control applications optimized for machine generated data from data sources, and delivering data and insights to downstream applications and persistent storage.
The Stream Processor allows stateful custom code to be executed over stream or batch data sources in a resilient manner, scaling up when data sources allow. This code can be used to perform a wide range of ingest, transform, process, enrich, and general analytics operations.
Stream processing
Stream processing is the practice of taking one or more actions on a series of data that originate from one or more systems that are continuously generating data. Actions can include a combination of processes, with examples like:
- Ingestion: inserting the data into a downstream database.
- Transformation: changing a string into a date.
- Aggregations: calculating the sum, mean, or standard deviation.
- Analytics: predicting a future event based on data patterns.
- Enrichment: combining data with other data, whether historical or streaming, to create context or meaning.
These actions may be performed serially, in parallel, or both, depending on the use case and data source capabilities. This workflow of ingesting, processing, and outputting data is called a stream processing pipeline.
This section includes details on the following topics:
- Index of pipelines: View a list of all pipelines.
- Running pipelines: View running pipelines.
- Pipeline status: Check the status of all your pipelines.
- Pipelines tab: Learn about the layout of the pipelines tab and how you use it to build pipelines.
- Building pipelines: Instructions on how to build a pipeline using operators, including an example.
- Pipeline settings: Manage pipeline resources, environment variables and tuning pipeline settings.
- Deploy, test and save: Guidance on deploying, testing and saving pipelines.
Pipelines Index
Click on Pipelines in the left-hand menu to view a list of all your pipelines.
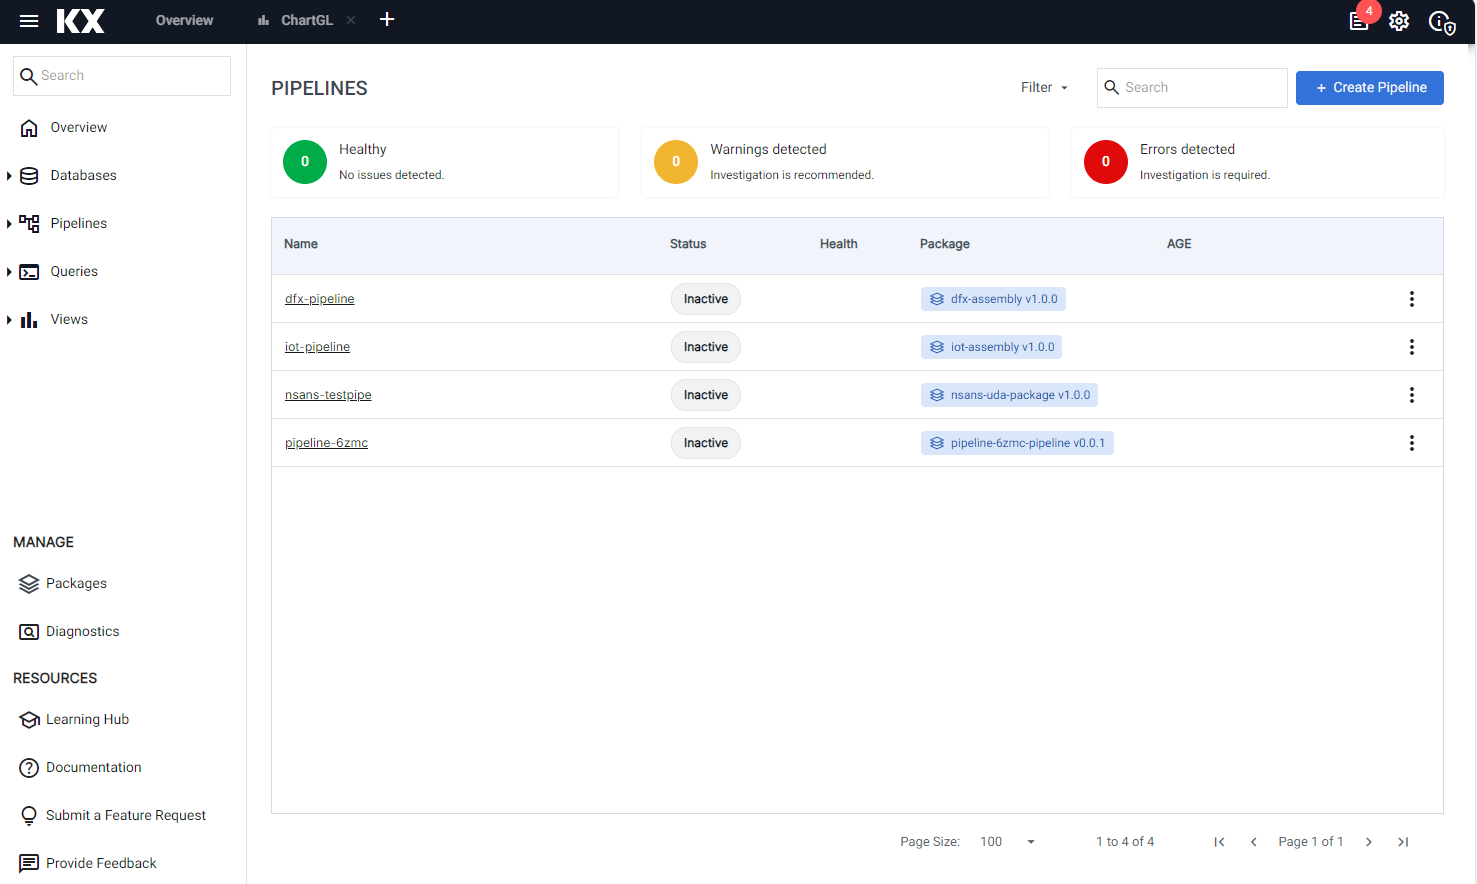
The following details are displayed:
| Item | Description |
|---|---|
| Name | The pipeline name. Click on the name to view details about the pipeline in the pipeline tab. |
| Status | The current status of your pipeline. Hover over the status value for additional information. |
| Health | This column displays the health status of the pipeline. A value of Healthy indicates there are no reported issues with the pipeline and is shown for status of Finished, Running. When an error occurs, a warning message is displayed indicating that attention is required. Refer to warnings and remediation actions for details about these errors and how they can be resolved. |
| Package | The name and version of the package containing this pipeline. |
| Age | The time since the pipeline was last deployed. |
| Actions | Click the three dots, to the right of the pipeline details, to view a list of pipeline actions. You have options to Rename and Delete a pipeline. |
Click Create Pipeline to create a new pipeline.
Running Pipelines
The Overview page displays information about running pipelines.
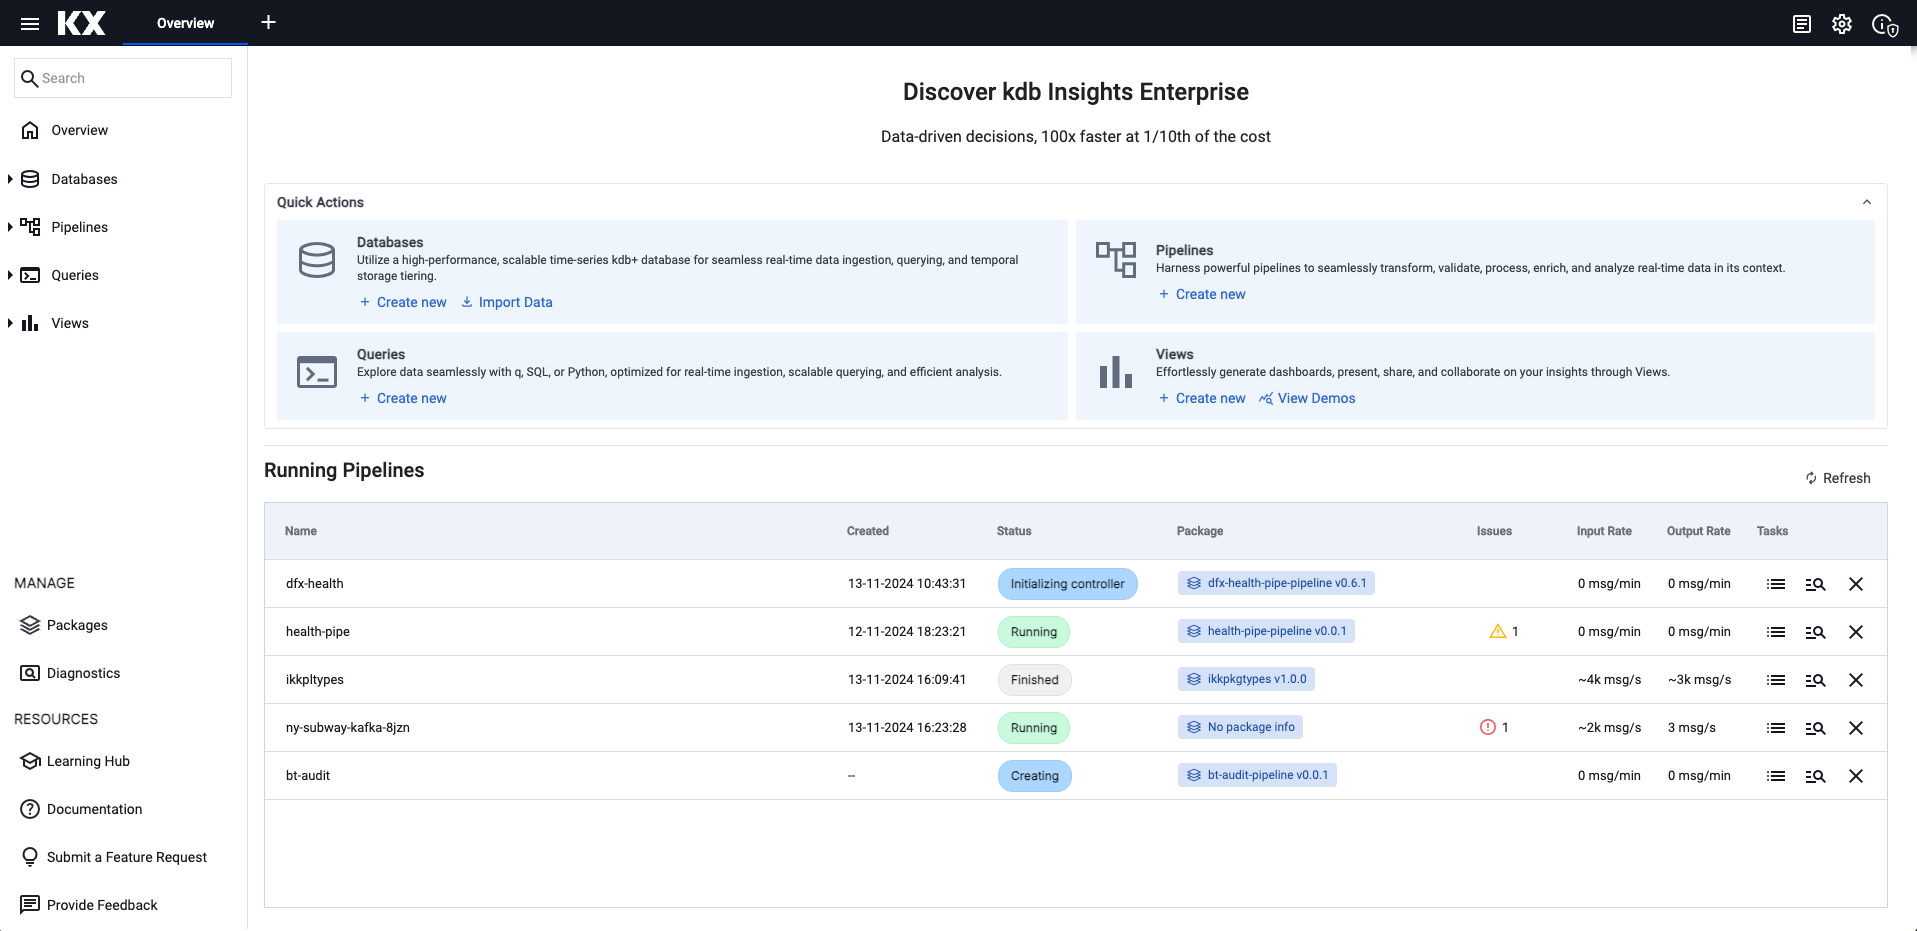
The following details are displayed.
| Item | Description |
|---|---|
| Name | The pipeline name. Click on the name to view the Pipeline details screen. |
| Created | The date and time the pipeline was deployed. |
| Status | The current status of the pipeline. See pipeline status for a full list of status values. |
| Package | The name and version of the package containing this pipeline. |
| Issues | An icon showing the number of issues. Click the icon to view pipeline-related logs in the Application Logs screen. |
| Input Rate & Output Rate | By default, pipelines enable record counting for all their readers and writers. This allows the pipeline to calculate the average number of records entering and exiting the pipeline over the last 5 minutes. If record counting is disabled, input and output rates will not be available. |
| Tasks | Click the View Logs icon to open the Application Logs screen and view logs relating to this pipeline. |
| View Diagnostics icon | Click this icon to go to the Diagnostics Events screen to view details of events relating to this pipeline. |
| Teardown | Click the Teardown icon to teardown the pipeline. Tearing down a pipeline stops data processing. Click Cleanup resources after teardown if you want to delete all pipeline checkpoints and user states. Data that has already been written down is not affected. |
Pipeline status
The status of a pipeline can be checked in two places:
A pipeline can have one of the following status values:
| Status | Description |
|---|---|
| Creating | Pipeline SP Controller is being created. |
| Initializing controller | Pipeline SP Controller has been created. |
| Partitioning workers | Pipeline is in the process of distributing partitions among one or more Workers. |
| Ready to receive data | Pipeline is ready to start, but is not yet processing messages. |
| Running | Pipeline is running and processing messages. |
| Unresponsive | Pipeline SP Controller is not responding to HTTP requests. |
| Errored | Pipeline errored before starting. This does not include errors encountered while processing messages. |
| Tearing down | Pipeline is in the process of tearing down. |
| Finished | Pipeline has finished processing messages, but has not been torn down. |
| Not Found | Pipeline does not exist. |
The status of a pipeline can be viewed in the UI in two places:
-
The status of all running pipelines can be seen on the Overview page.
This following details are displayed:
Item Description Name The pipeline name. Click on the name to go the Pipeline details screen. Created The data and time the pipeline was deployed. Status The current status of the pipeline. Refer to the table above for a full list of status values. Issues An icon showing the number of issues. Click the icon to got to the Application Logs screen to view logs relating to this pipeline Input Rate Refer to input rate. Output Rate Refer to output rate. Tasks Click this icon to got to the Application Logs screen to view logs relating to this pipeline. View Diagnostics icon Click this icon to go to the Diagnostics Events screen to view details of events relating to this pipeline. Teardown icon Click this icon to teardown the database. Tearing down a pipeline stops data processing. Click the Cleanup resources after teardown checkbox if you want to delete all pipeline checkpoints and user states. Data that has already been written down is not affected. -
The status of all pipelines can be seen on the Pipelines index page. Click on Pipelines in the left-hand menu. This shows their current status as well as information on the health and age of each pipeline.
This following details are displayed:
Item Description NAME The pipeline name. Click on the name to go the Pipeline details screen. STATUS The current status of your pipeline. Hover over the status value for additional information. Refer to the table above for a full list of status values. HEALTH This column displays the health status of the pipeline. A value of Healthy indicates there are no reported issues with the pipeline and is shown for status of Finished, Running. When an error has been encountered a warning message is displayed indicating that attention is required. Refer to warnings and remediation actions for details about these errors and how they can be resolved. AGE The time since the pipeline was last deployed. TASKS Click the three dots under Tasks to view a list of pipeline actions. You have options to Export, Rename and Delete a pipeline.
Pipeline API status values
If you are using the pipeline APIs such as the details or status API, the statuses are as follows:
CREATINGINITIALIZINGPARTITIONINGREADYRUNNINGUNRESPONSIVEERROREDTEARING_DOWNFINISHEDNOTEXIST
Pipelines tab
-
Use one of the following methods to open the Create Pipeline dialog:
- Click + on the ribbon menu and select Pipeline.
- Click + beside Pipelines on the left-hand menu.
- Click Create Pipeline in the pipelines index.
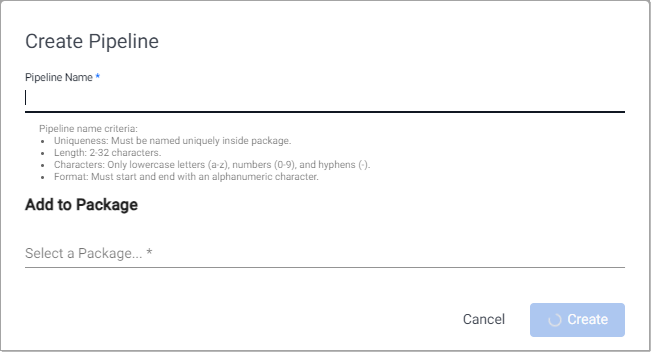
-
Enter a Pipeline Name that is unique within the package, 2-32 characters long, uses lowercase letters, numbers, and hyphens, and starts and ends with an alphanumeric character.
-
Click Select a package under Add to Package, to display the list of packages this pipeline can be added to added to.
Click Create new package if you want to add the pipeline to a new package. Enter a unique package name that is 2-32 characters long, uses lowercase letters, numbers, and hyphens, and starts and ends with an alphanumeric character.
See packages for further details about packages.
-
Click Create.
The Pipeline tab opens, as shown below.
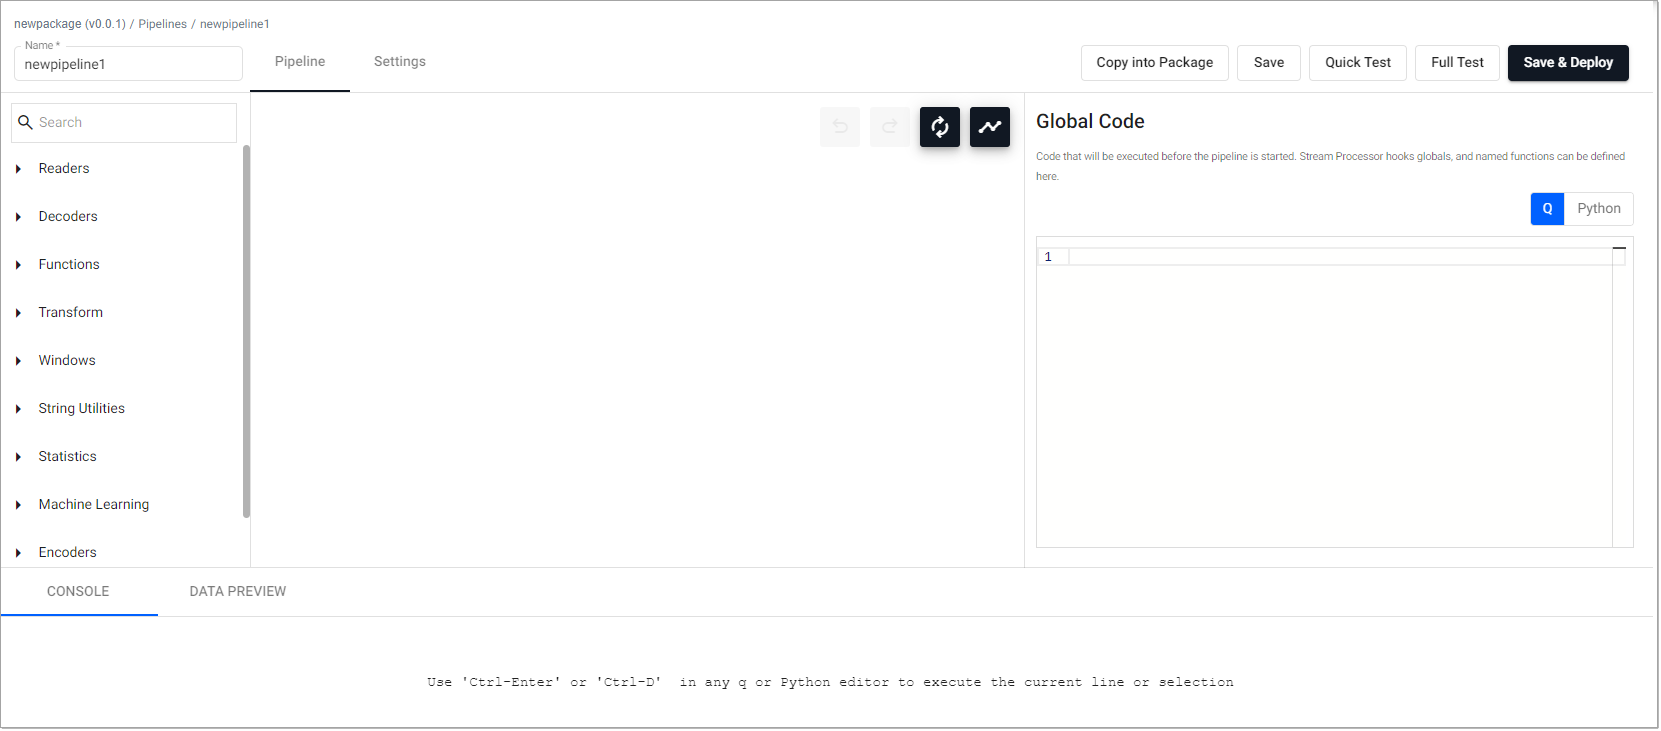
From here you can build a pipeline, with additional settings available on the Settings tab.
Nodes and Operators
The terms operators and nodes are used interchangeably within this document and within the user interface.
The Pipeline tab has a number of elements, described in the following table.
| Section | Description | ||||||||||
|---|---|---|---|---|---|---|---|---|---|---|---|
| Breadcrumb | The top left-hand corner of the tab has breadcrumb information showing the package name and version appended in parenthesis. Click on the package name to open the Package Entities dialog box that displays all the entities; database(s), pipeline(s), and view(s) this package contains. | ||||||||||
| Name | The pipeline name is displayed in the top left-hand corner of the screen. A default name is applied when the pipeline is created. You can change this. The name you set must be lowercase, only include letters and numbers, and exclude special characters other than hyphen (-). | ||||||||||
| Operators Menu | The left-hand panel shows a search box and list of operators. Operators are the building blocks for pipelines. Each operator is capable of operating on data in a stream but each has a specific function. There are different types of operators used to perform different functions. | ||||||||||
| Pipeline builder | The pipeline builder area is located in the center of the screen. You build pipelines by adding operators to the workspace and joining them with the operator-anchors. Operators can be removed on a right-click, or added by click-and-drag from the entity tree, or a right-click in an empty part of the workspace. To change a connection, roll over to display the move icon and drag-connect. Remove connections with a right-click on the connection you want to delete. |
||||||||||
| Graph options | The pipeline builder contains a number of options you can use when working with pipelines.
|
||||||||||
| Global Code | When no operator is selected, the right-hand panel contains the Global Code configuration. Global Code is executed before a pipeline is started. This code may be necessary for Stream Processor hooks, global variables, and named functions. | ||||||||||
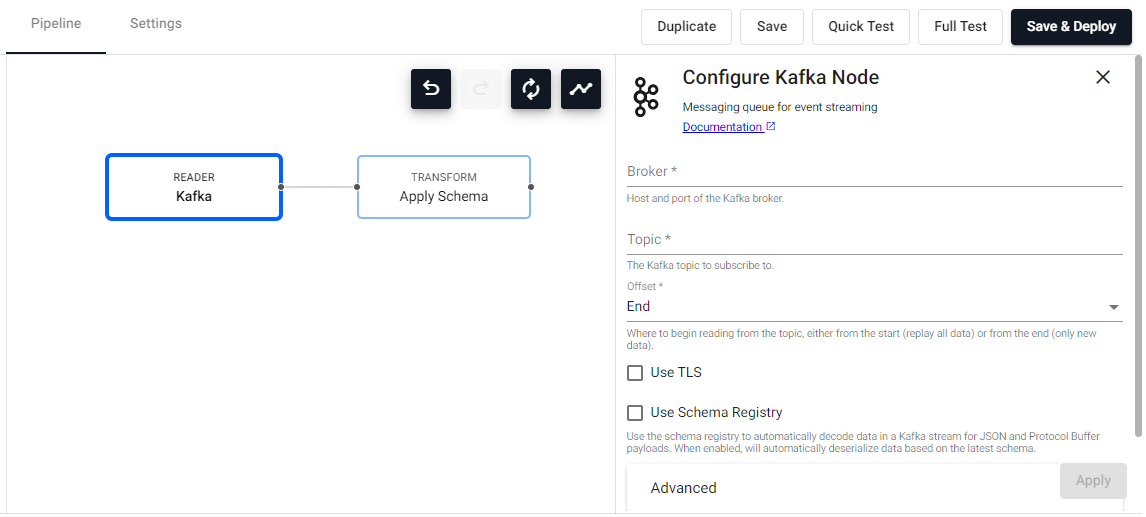
| Operator Configuration | When an operator is selected, the right-hand panel contains the configuration details for the selected operator. For example, the following screenshot shows the configuration for the Kafka operator. 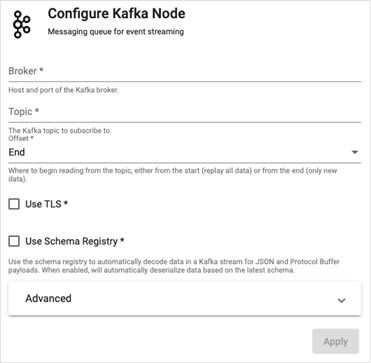
| ||||||||||
| Advanced Operator Configuration | Some nodes support additional advanced configuration that can be accessed by clicking the gear icon in the top right corner of the node configuration panel. For example, the Map node has advanced configuration options, as shown here. 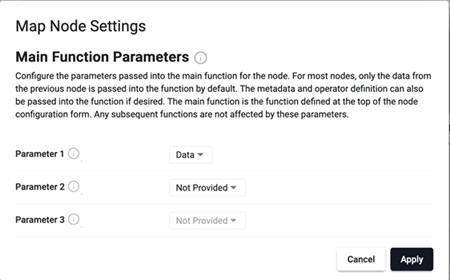 Nodes that don't support this feature do not have the gear icon present. Refer to the q API for more details about advanced node configuration. | ||||||||||
| Actions | When an operator is added, the right-click menu has a number of actions that can be performed on the operator, such as Rename, Remove, and Duplicate. To undo any of these actions, click Undo. 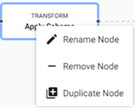
| ||||||||||
| Console | All q or Python editors in the Operator Configuration sections are executable and can be used to interactively develop complex functions. The current selection or line can be executed using 'Ctrl-Enter' or '⌘Enter' and the output viewed in the Console tab in the bottom section of the pipeline tab. | ||||||||||
| Data Preview | Results of test deploys are displayed in the Data Preview tab in the lower panel of the pipeline tab.Click on an operator to see the results at each step along the pipeline. |


Building a pipeline
To build pipelines, you start by adding and connecting operators within the pipeline builder. At a minimum, for a pipeline to produce any output, it requires a reader and a writer operator. However, when building or debugging a complex pipeline, it can be useful to start with just a reader and test/deploy the pipeline iteratively as additional nodes are added.
This section provides step-by-step instructions, followed by an example.
Database selection
If a database hasn’t been created yet, create the database before proceeding with pipeline configuration. The initial database setup includes a default table and schema, and you can add more tables to the database schema as needed.
-
Open the pipelines tab and click and add operators to the pipeline builder.
- Add operators by clicking and dragging them from the menu of operators on the left.
- Remove operators by right-clicking on the node and selecting Remove Node.
- Join operators using the operator-anchors. Click and drag an anchor on one operator to the anchor on another operator.
- To change a connection, rollover to display the move icon and drag-connect, remove with a right-click.
- Click an operator to configure it using the configuration section on the right.
You can select from the following types of operators:
- Readers read data from an external or internal data source.
- Writers send data to an internal or external data sink.
- Functions provide building blocks for transforming data by mapping, filtering or merging streams.
- Encoders map data to serialize data formats that can be shared out of the system with writers.
- Decoders deserialize incoming data into a kdb+ representation for manipulation.
- Windows group data into time blocks for aggregating streams.
- String Utilities perform string operations on data.
- Transform operators provide low code and no code transformations for manipulating data.
- Machine Learning operators can be used to build prediction models of data in a stream.
-
Nodes that contain a main function, such as Apply and Map nodes, support customization of the parameters that are passed into that function. See main function parameters for further details.
-
Configure each of the pipeline operators. Click on the node to display operator parameters in the panel on the right. The following screenshot shows the operator parameters for a Kafka node.
Certain fields are required and you cannot save or deploy the pipeline without setting these field values.
Development of stream processor pipelines within the UI allows for logic to be written in Python. See python code in pipelines for details.
-
Rename the pipeline by typing a new name in the name field in the top left corner.
-
Click Save to save the pipeline configuration.
-
Its is advisable to test your pipeline before deploying it. See test deploy for details.
-
Ensure the database associated with this pipeline is deployed. A pipeline can be associated with a database prior to deployment, or deployed directly to an active database. See deploying the database for details.
-
When you are satisfied with your pipeline, deploy it by clicking Save & Deploy.
Once it's running, it shows in the list of running pipelines in the Overview page and is added to the list of pipelines on the Pipelines index.
A running pipeline can then be queried. See query data for details.
A full example pipeline setup is provided below.
Kafka & Postgres Setup
When using Kafka and Postgres pipelines, relevant charts must be installed, running, and accessible on the cluster.
Lower Case required
When configuring pipelines, lower case must be used in all instances of names and references.
Customizing Main Function Parameters
Nodes that contain a main function also support customizing the parameters that are passed into that function. For most nodes, only the data from the previous node is passed into the main function as the only parameter. However, metadata and the operator definition can also be passed into the function if desired. This can be helpful when needing to action based on the data's metadata, or if needing to use Stream Processor functions like .qsp.set and .qsp.get. This works for both q and Python functions.
Changing the parameters
After changing these settings you must update your function to accept the new parameters and make use of them.
Main function
The 'main function' is the function defined at the top of the node configuration form. Some examples of nodes that use a 'main function' and have customizable parameters are the Apply and Map nodes. These parameter settings only apply to the main function field. Any subsequent functions defined after the main function are not affected by these settings.
Example
The following example demonstrates the creation of a simple pipeline.
For more examples take a look at some of the guided walkthroughs.
Before you build the pipeline, create and deploy this database as follows:
- Database name =
example-db -
Table name =
table1with the following columns:Column Name Column Type Parse Strings dates Timestamp Auto instance Symbol Auto sym Symbol Auto count Integer Auto -
In the pipelines tab drag the Reader node Expression into the pipeline builder.
-
Click on the Expression node and add the following code to the operator configuration section on the right and click Apply.
This q code sample generates a table with 2000 rows, each containing a random date from the last 10 days, a random instance from four options, a random currency symbol from four options, and a random count between 0 and 9.n:2000; ([] dates:n?(reverse .z.d-1+til 10); instance:n?`inst1`inst2`inst3`inst4; sym:n?`USD`EUR`GBP`JPY; cnt:n?10) -
Drag the Transform node Apply Schema into the pipeline builder.
-
Click on the Apply Schema node:
- leave the Data Format as Any (required).
- Click the Load Schema icon and select a database.
- Click Load, to load the schema details and click Apply.
-
Join the Expression node to the Apply Schema node.
-
Drag the Writer node kdb Insights Database into the pipeline builder and connect it to the Apply Schema node.
-
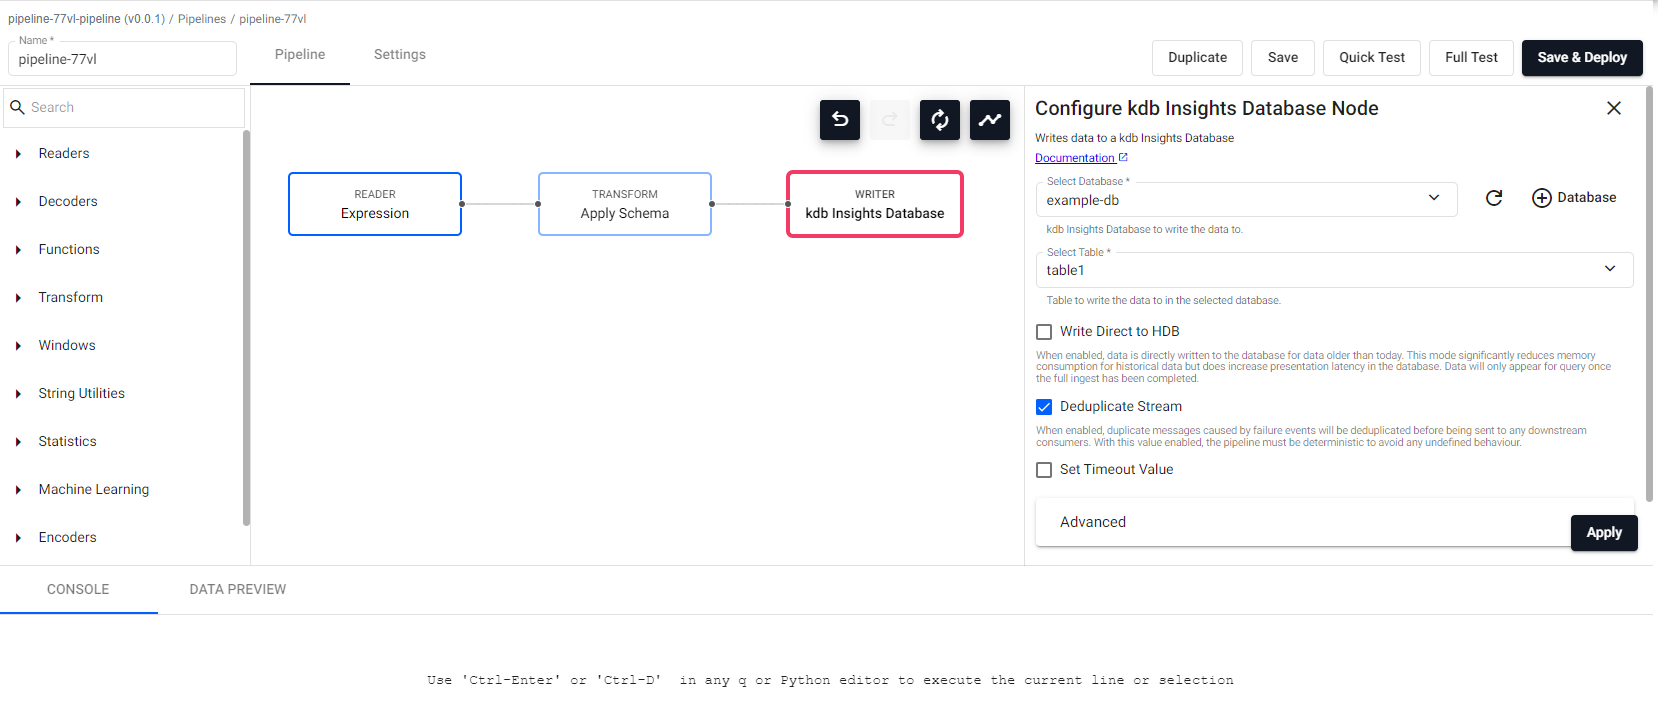
Click on the kdb Insights Database node and configure it as follows, then click Apply.
property | setting ------------------ | ------- Select Database| `example-db` Select Table | `table1` Write to HDB | Unchecked Deduplicate Stream | Checked Set Timeout Value| Unchecked -
Review the completed pipeline
-
Click Save & Deploy.
- Check the status of your pipeline and once it is
Runningyou can query the data. - Query the data by running the following query in the SQL query tab:
Select * from table1.
Copy pipeline into Package
You can copy a pipeline into a package.
-
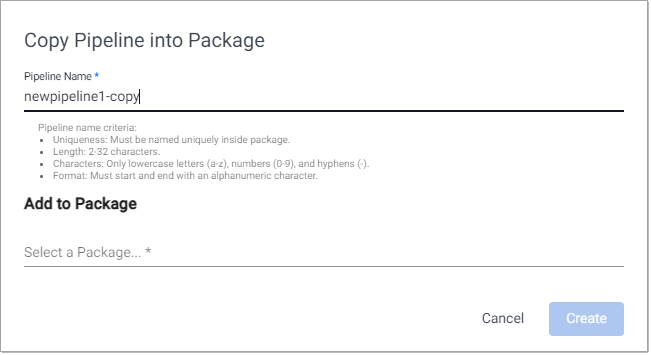
Click Copy into Package top open the Copy Pipeline into Package dialog.
-
The Pipeline Name is auto-filled with
pipeline-name-copy. Change the name if required. - Click Select a Package under Add a Package. Either select an existing package, to add this copy of the pipeline to, or click Create new package to add the pipeline copy to a new package.
-
Click Create. The pipeline (including settings and nodes) is created in the selected or newly created package.
The copied pipeline is opened.
Save, Test, Deploy and Teardown
Save
In the pipeline tab click Save to save the pipeline. A pipeline must be deployed in order to ingest data.
Quick test
Run a quick test deploy in the scratchpad to validate that the pipeline works. See test deploys for more information.
Full test
Run a full test deploy using worker and controller pods to validate that the pipeline works. See test deploys for more information.
Deploy
It's advisable to test deploy your pipelines before performing a full deployment. Test deploys allow you to validate the output without any data being being written from the writers.
To deploy your pipeline, click Save & Deploy. The pipeline initializes and starts running.
- See pipeline status for details on how to check if your pipeline has deployed successfully.
- Deployed pipelines are deployed indefinitely.
- If a deployed pipeline errors, it remains deployed.
- To stop a running pipeline tear it down
Teardown
Tearing down a pipeline stops data processing. Use one of the following methods to teardown a pipeline:
- Click Teardown on the pipeline tab for the active pipeline.
-
Click X on the Running Pipelines section of the overview page.
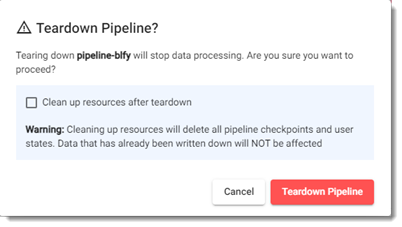
Click Teardown Pipeline to stop data processing.
If you want to delete all pipeline checkpoints and user states tick the Clean up resources after teardown check box before you click Teardown Pipeline.
Python code within pipeline UI
Development of stream processor pipelines within the UI allows for logic to be written in Python. The following sections outline the requirements and caveats that you should bear in mind when developing such nodes.
Writing Python code within the pipeline UI
When defining the code which is to be used for a given node you need to take the following into account:
- The parsing logic used to determine the function used within a Python node works by retrieving for use the first function defined within the code block. The entire code block will be evaluated but it is assumed that the first function defined is that is retrieved is that used in execution.
- Only Python functions are currently supported for definition of the execution function logic. You should not attempt to use
lambdasor functions within classes to define the execution logic for a node. Additionally, while functions/variables defined within the global code block can be used within individual nodes, they cannot be referenced by name as the definition of the function to be used. - All data entering and exiting an executed Python node block will receive and emit it's data as a
PyKXobject. The PyKX documentation provides outlines on how these objects can be converted to common Python types and additionally includes notes on performance considerations which should be accounted for when developing code which interacts with PyKX objects.
The following provides an example of a map and filter node logic which could be used on a pipeline:
import pykx as kx

def map_func(data):
    # compute a three-window moving average for a table
    return kx.q.mavg(3, data)
    # Function expected to return a list of booleans
    # denoting the positions within the data which are to
    # be passed to the next node
def filter_func(data):
        return kx.q.like(data[0], b"trades")
Next Steps
- Read more about pipeline operators
- Configure pipeline settings
- Test pipeline configuration
- Troubleshoot pipelines