Query Window
This page introduces you to the Query window which is used to query and analyze data in your kdb Insights Enterprise deployment.
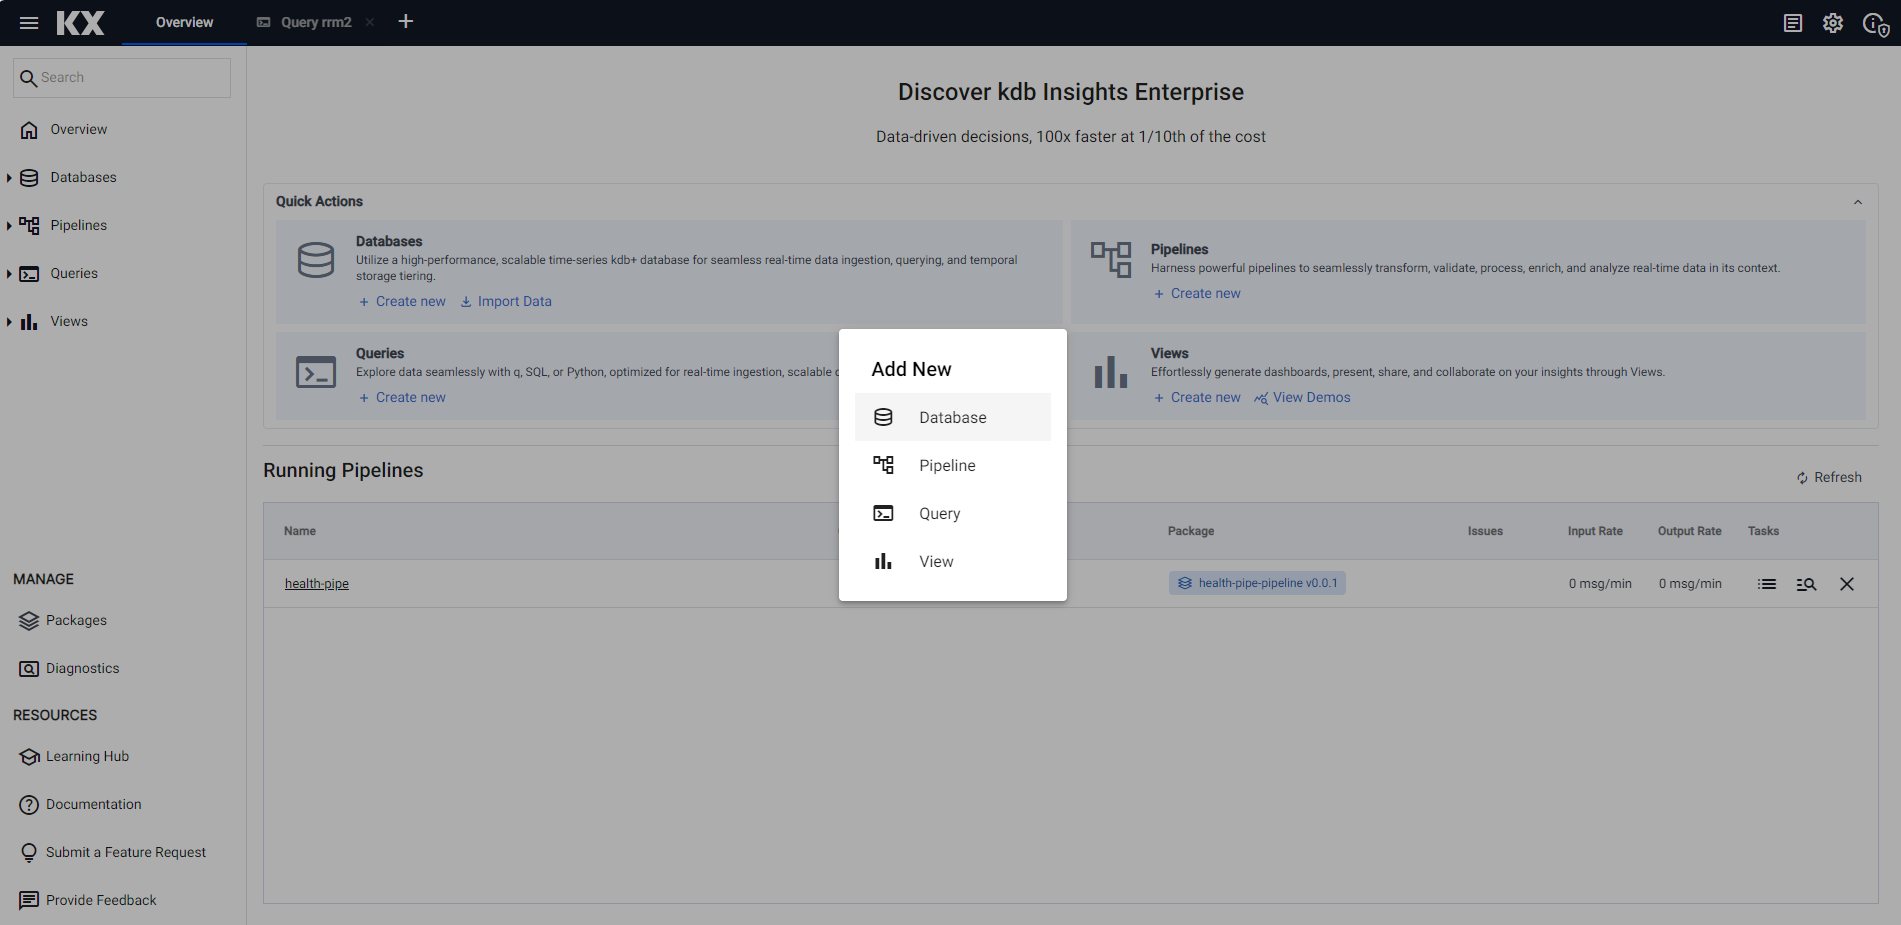
Open the Query window
The Query window is used for data query and analysis, providing an isolated location where you can explore available data, write/debug pipelines, and prototype analytics without impacting production workloads.
Use one of the following methods to open the Query window:
-
Click + on the ribbon menu and select Query
-
Click + beside Queries on the left-hand menu
-
Click Create New, on the Queries tab, on the Overview page
Query window layout
The Query window is divided into three panels, shown here and described below:
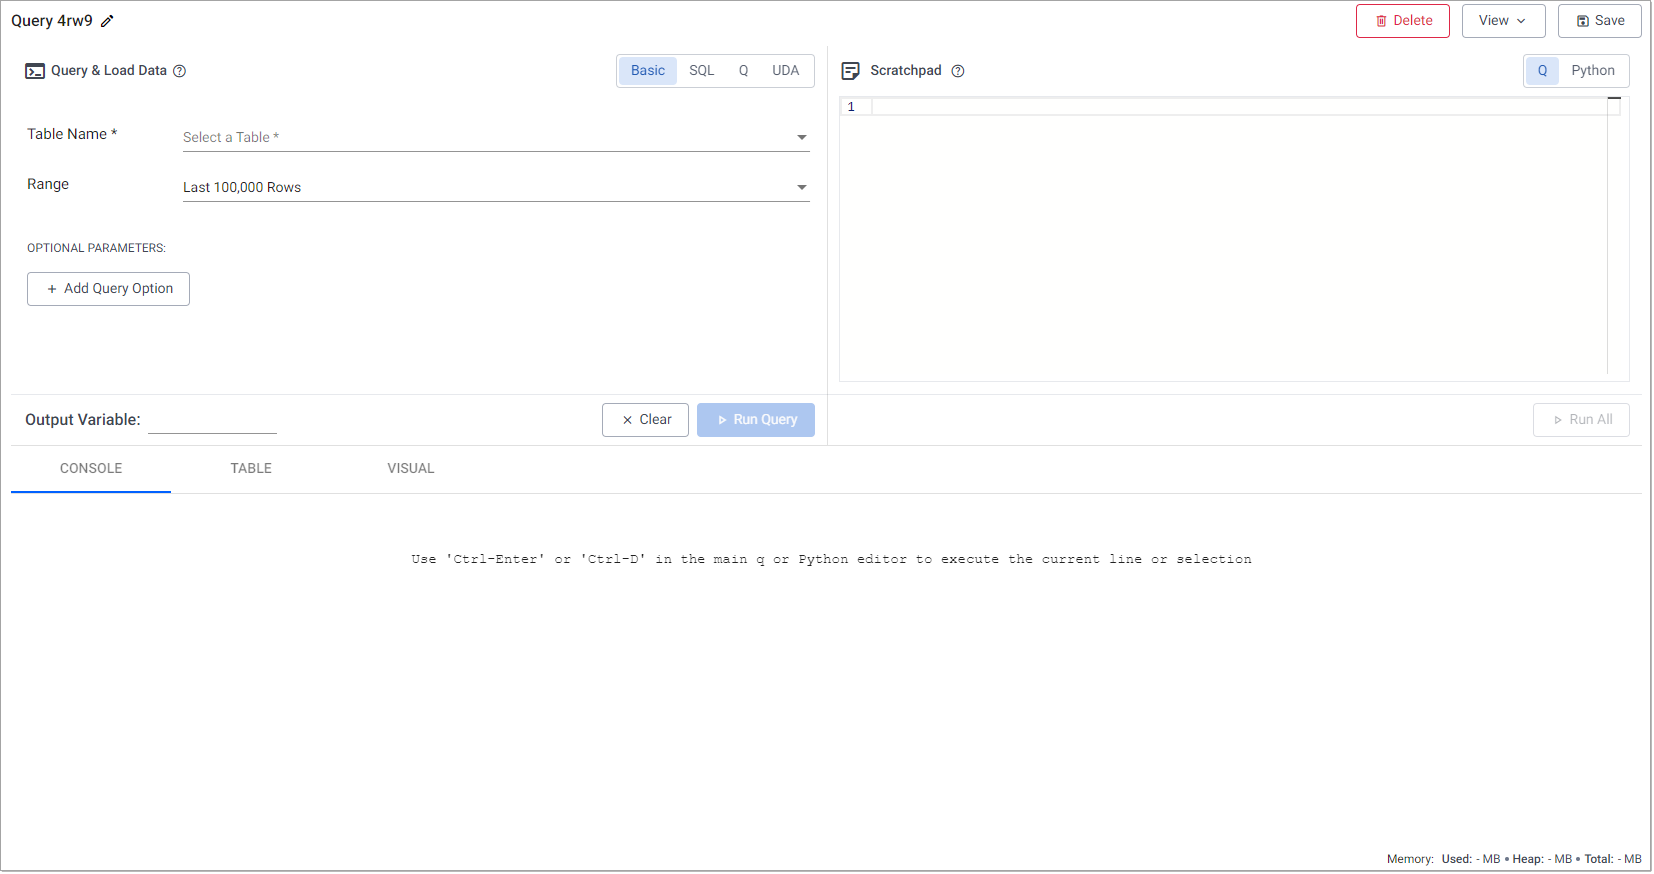
- Use the Query & Load Data panel to query the database, using either a basic query, SQL, q, or UDA allowing you flexibility in choosing how you access your data.
- The Scratchpad Panel is where you can perform ad hoc queries on data you have queried from the database. You can complete further analysis and development in Python or q. This allows you to create functions for use throughout kdb Insights Enterprise.
- The Output Panel tabs provide areas where you can view the output from your queries, as either raw data in the Console, a formatted Table, or a chart in the Visual tab.
The top of the window has three buttons:
| Delete | ||
| View | This lets you free up space on the screen if you are not using a panel. |
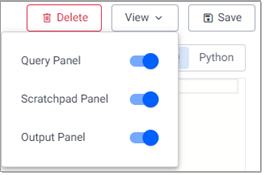 |
| Save |
Memory Usage
The scratchpad memory usage and limit are shown at the bottom of the Query window.
| Used | 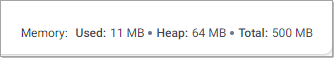 |
|
| Heap | This lets you free up space on the screen if you are not using a panel. |
|
| Total |
Next Steps
- Use the Query panel to query the database
- Use the Scratchpad to perform ad-hoc queries
- Develop Python code within the scratchpad
- Develop q code within the scratchpad
- Visualize results in the console and graphically