Custom Analytics Developer Guide
This page is intended to be used with the Add Custom Analytics guide to show how custom analytics can be developed and tested.
It requires the fsi-app-eqea accelerator to be deployed on insights.
This guide makes use of the KX VSCode extension. Refer to the documentation to learn how to install and use this extension.
Connecting to fsi-app-eqea-qe-dap hdb
A good environment for testing the custom analytics is the fsi-app-eqea-qe-dap hdb. You have access to the current analytics config and are able to add custom code to test.
There are two methods of connectivity, depending on what level of access you have. The ideal workflow is to be able to port forward the fsi-app-qe-dap-hdb such that an interactive session can be directly connected.
If access to kubectl and port forwarding is not possible, then you must connect to insights via vscode and open a connection and communicate down a handle.
Connecting directly to fsi-app-eqea-qe-dap hdb via port forward
To be able to connect to the qe-dap hdb, do the following.
-
Port forward the qe-dap hdb:
```shell kubectl port-forward $PROC_NAME $PORT_FWD:$PORT_POD #example kubectl port-forward fsi-app-eqea-qe-dap-db-0 6060:5081 ``` !!! note "`PORT_POD` is the port of the process and `PORT_FWD` is the local port we want to use." -
Open a connection using the KX extension in VSCode:
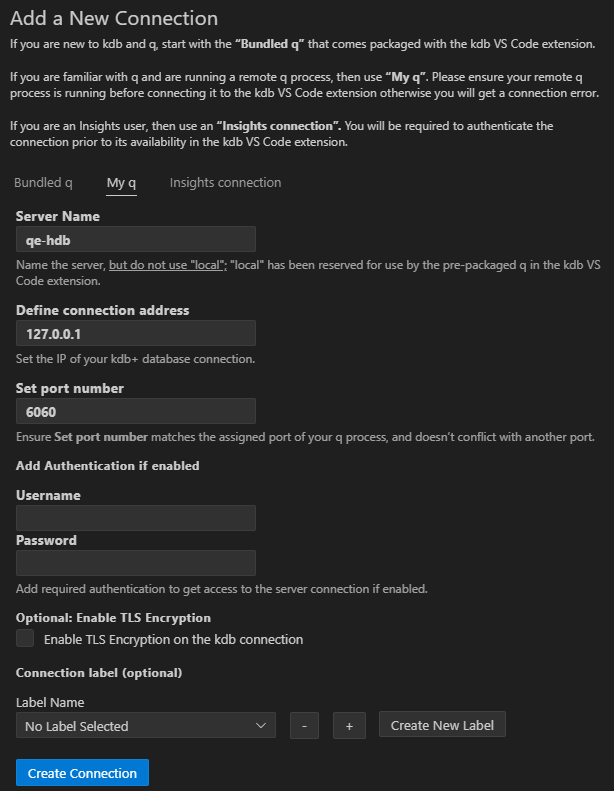
-
Once connected to the hdb, you can locally call the Order Analytics API:
```q
dt:2023.12.22;
args:`table`startTS`endTS!(`Order;`timestamp$dt;(`timestamp$dt+1)-1);
res:first .fsi.eqea.generateOrderAnalytics args
```
Connecting to fsi-app-eqea-qe-dap hdb via insights
If port forwarding is not available, we can create an insights connection from the KX panel in VSCode:
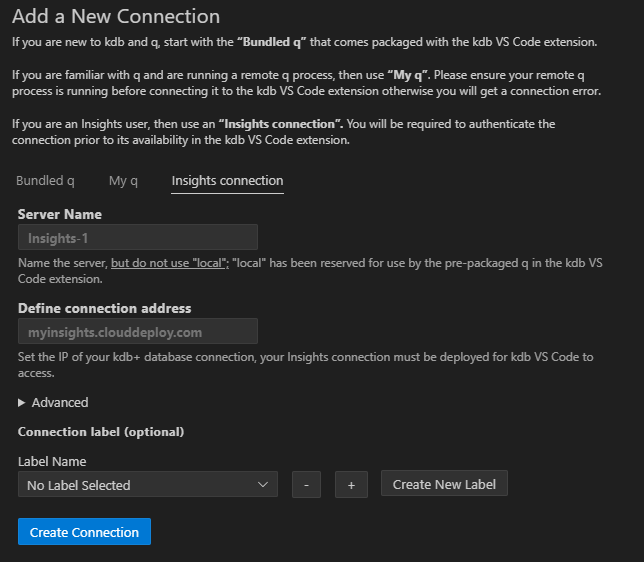
Once created the connection should be visible under connections. Right-click and select Connect server. Now the below code can be run to connect to the hdb and run the API:
// Open a handle to the qe hdb
hdb:hopen`$":fsi-app-eqea-qe-dap-db:5081"
// Calls can now be sent via the handle
hdb"dt:2023.12.22;";
hdb"args:`table`startTS`endTS!(`Order;`timestamp$dt;(`timestamp$dt+1)-1);";
hdb"res:first .fsi.eqea.generateOrderAnalytics args"
Testing custom analytics
Using the results table created above, you can test any custom analytics you want to add. See the example using the `myArrivalTradePrice analytic here:
// Check to show that custom analytic not in results
 `myArrivalTradePrice in cols res;

//Add custom analytic example to .eqea.analytics.cfg

.eqea.analytics.cfg:.eqea.analytics.cfg,flip `analytic`analyticType`funcName`aggClause`marketDataTabName`joinTimeOffset! flip (enlist
        (`myArrivalTradePrice           ;`ajExample   ;`.example.orderExecution.ajExample                ; `price                                ; `Trade     ; 00:00:00 )
        );

//Define the custom analytic function
.example.orderExecution.ajExample:{[OrderAnalyticsRes]

    // We can use `.eqea.util.runTickDataAnalytics` to run analytics which retrieve values from tick data using an as of joins
    cfg:select from .eqea.analytics.cfg where analyticType=`ajExample;
    OrderAnalyticsRes:.eqea.util.asof.ajFromCfg[OrderAnalyticsRes;cfg;`strikeTime];
    OrderAnalyticsRes

    };

// Run custom analytic function with res table
new:.example.orderExecution.ajExample[res];

//Check the custom analytic has been calculated
`myArrivalTradePrice xcols new
Once you are happy with the custom analytics, follow the steps to add the code and repackage the accelerator here.
Run API using GW
Once the changes have been pushed, you can check the new analytics return using the API call on the gw:
gw:hopen`$":insights-sg-gateway:5050"
args:(!) . flip (
        (`table             ; `Order);
        (`dt                ; 2023.12.22);
        (`scope             ; (enlist`assembly)!(enlist `$"fsi-app-custom-eqea"))
        );

opts:()!()
last gw(`.fsi.eqea.generateOrderAnalytics;args;`callback;opts);