kdb Insights Enterprise Product Tour
This product tour lets you try out selected features of kdb Insights Enterprise such as querying sample data, configuration of code in an easy-to-use interface and instant visualization.
Important
The product tour is only available with our free trial. If you don't have the free trial, it's easy to sign up.
Please note that resources in Free Trial are only provisioned for the activities described in these instructions. Be aware that if you perform additional analysis you may encounter issues and unexpected behaviour due to these constraints.
Aim
This product tour shows the power and speed of the data analytics using kdb Insights Enterprise and the insights you can discover by running queries on the NYC taxi dataset showcasing the use of SQL, q, and Python.
This tour aims to answer the following questions:
- How many trips occur each day?
- What is the average fare each day?
- What is the average number of passengers per trip each hour?
- When are people giving the most tips?
- Does the distance of journey have an impact on tips earned?
- How many trips fall under each rate type?
- How many trips to and from the airport were there each day?
The Dataset
This taxi dataset contains historical data from New York's yellow taxi network, provided by the NYC Taxi & Limousine Commission to gain insights into the journeys being taken.
The data contains approximately 3 million records from trips taking during the month of December 2021 which records attributes such as pick-up and drop-off dates/times, pick-up and drop-off locations, trip distances, itemized fares, rate types, payment types, and driver-reported passenger counts.
Data Analysis
In kdb Insights Enterprise data analysis is done in the Query tab; this is accessible from the [+] of the ribbon bar, or Query under Discover kdb Insights Enterprise of the Overview page.
![The query tab can be opened from the left-hand icon or menu tree, the [+] menu in the ribbon menu, or from the Query panel on the Overview page.](img/queryoverview.jpg)
The query tab can be opened from the left-hand icon or menu tree, and is available from the [+] menu in the ribbon bar, or from the Query panel on the Overview page.
The Query Tab Explained
- Get Data: for extracting the data for analysis. You can extract the data using SQL, q, or a set of controls in the UI.
- Scratchpad: for analyzing the extracted data. You can use python or q, whichever you prefer, choosing from the langauge option at the bottom right of this section.
- Output: for visualizing the analyzed data. To help you further inspect the data and gain insights faster it can be visualized in three different ways using the Console, Table, or Visual tabs.
The query tab with Get Data, Scratchpad and Output elements.
Explore The Data's Shape
- Open a Query session.
-
In Get Data, select either SQL or q, and add the appropriate code:
-- how many records are there?
SELECT COUNT(*) FROM trips
When using the
Qoption, first selectdatabase=taxiandinstance=hdbbefore running Get Data.// how many records are there? count tripsThere around 3 million records in the dataset.
Session initialization
Please note the first query you run with Get Data may take a little longer while the session is initialized.
-
Define an Output variable; this is a simple text name.
- Click Get Data.
Next
-
In Get Data, choose the
Qtab; selectdatabase=taxiandinstance=hdb, and add the following code.// what are the columns and datatypes? meta tripsSyntax explanation
The
metaoperator allows us to inspect the schema of the table. This returns to us a table of the available columns, their types, and other information. The following columns are produced:- c: column name
- t: column type
- f: foreign keys
- a: attributes: modifiers applied for performance characteristics
-
Define an Output variable; this is a simple text name.
- Click Get Data.
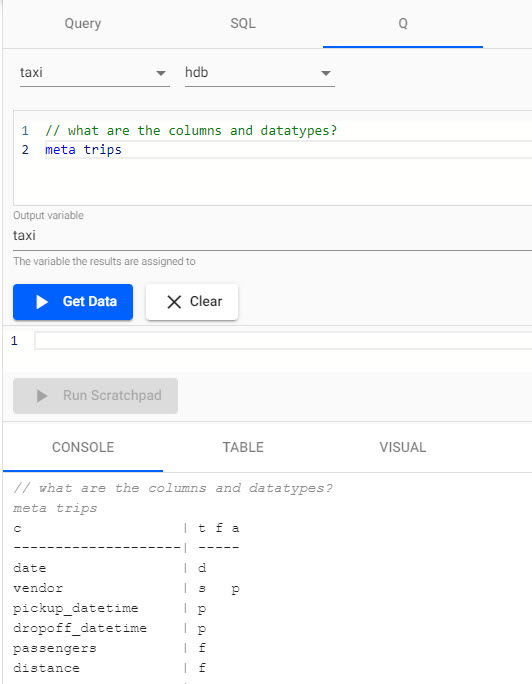
Output of meta trips run using q.
You see the columns that are part of the dataset and their types. Hopefully, you now have a better understanding of the size and shape of the data, which will assist with the later analysis.
You are now ready to start answering the questions posed at the beginning of the tour. You can use the same Get Data section to enter and execute the following queries.
Daily Trip Count
Choose either SQL or Q:
-- how many trips per day?
SELECT date, COUNT(*) AS num_trips
FROM trips
WHERE date BETWEEN '2021-12-01' AND '2021-12-31'
GROUP BY date
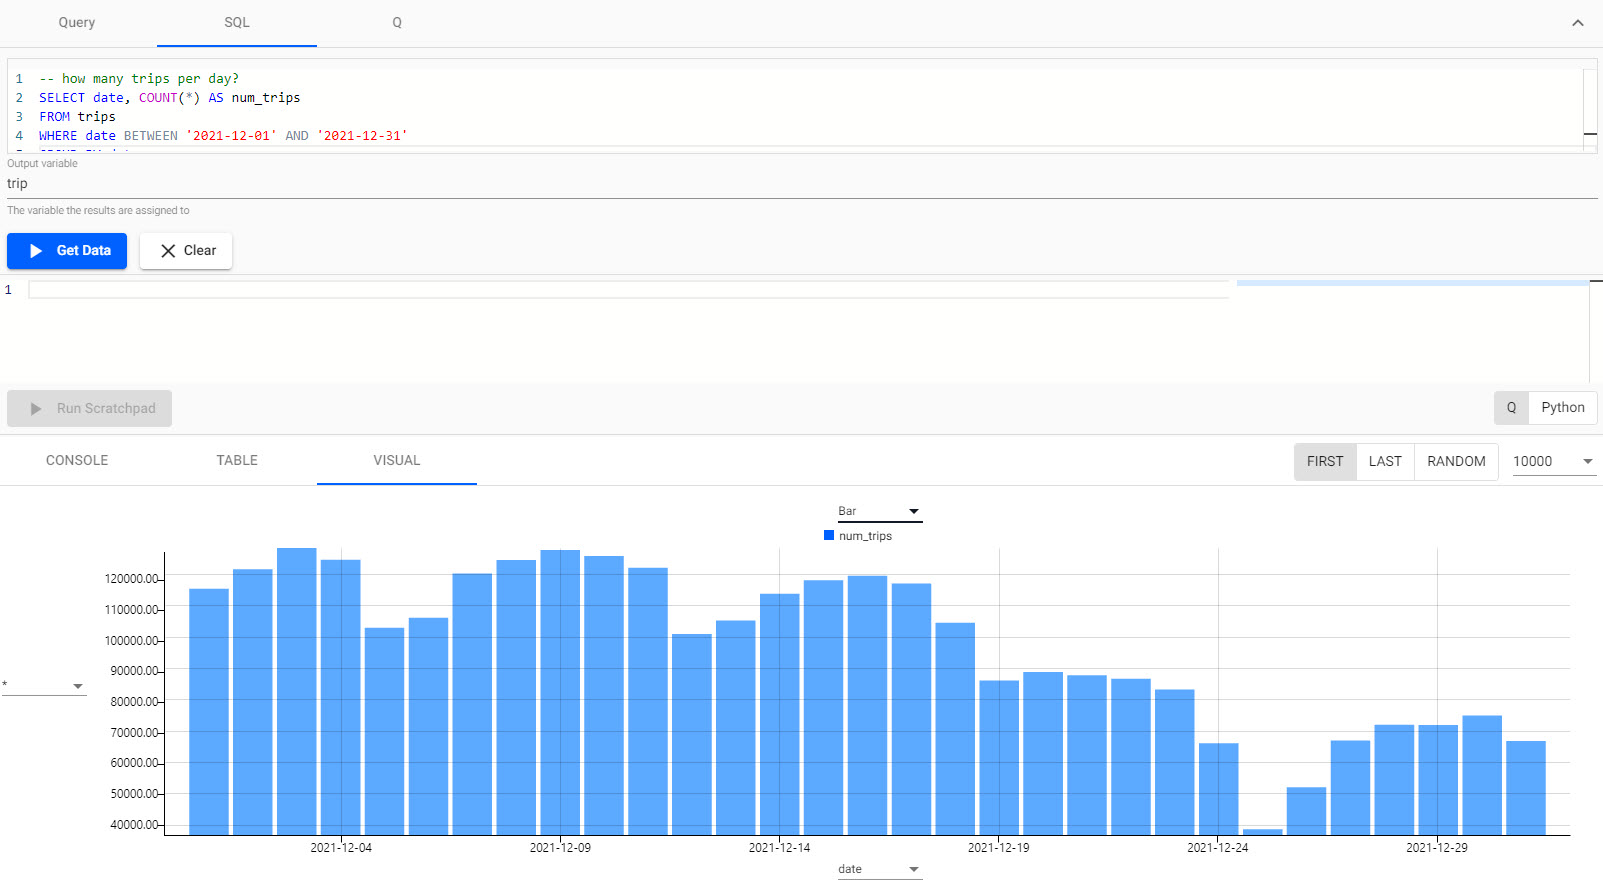
Daily trip count run using SQL.
Select database=taxi and instance=hdb.
// how many trips per day?
select num_trips:count i by date from trips where date within (2021.12.01;2021.12.31)
Syntax explanation
The above virtual column i maps to a record index in the table.
A simple aggregation can be obtained by taking the count of this virtual column.
To assign the resulting aggregation to a new column name in the resulting table, we simply use a colon :.
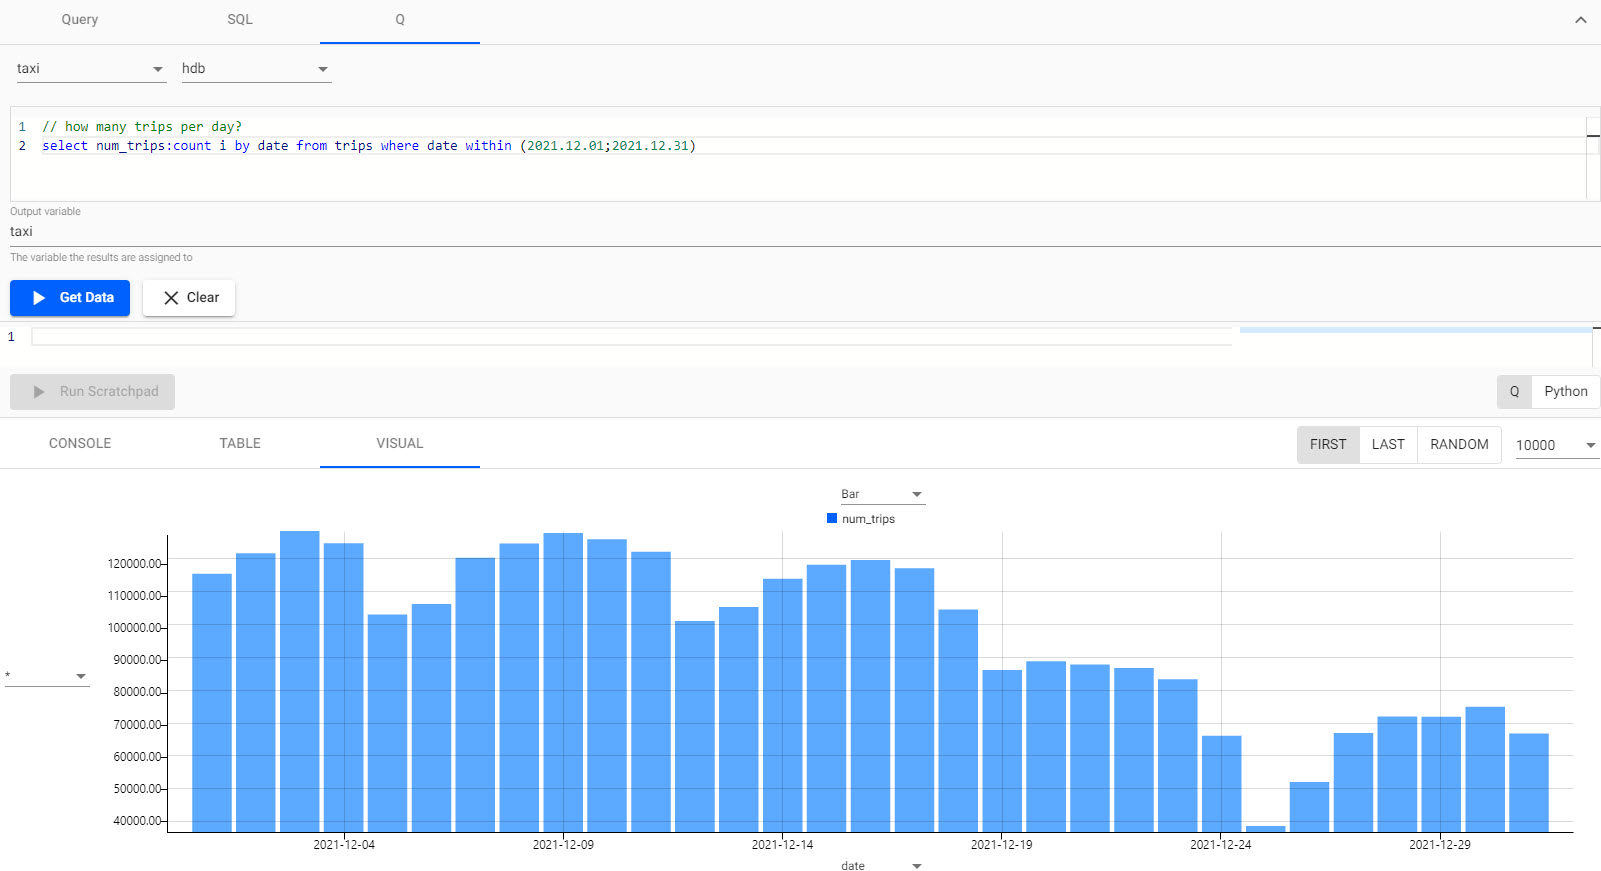
Daily trip count run using q.
How many trips occur each day?
Switching to the visual tab, you see that around 100,000 trips were taken per day during the month and that trips taken reduced towards the end of the month, with the lowest day being Christmas day.
This analysis could help taxi companies decide how many drivers are required on different days of the year.
Daily Average Fare
Choose either SQL or Q:
-- what is the average fare each day?
SELECT date, avg(fare)
FROM trips
WHERE date BETWEEN '2021-12-01' AND '2021-12-31'
GROUP BY date
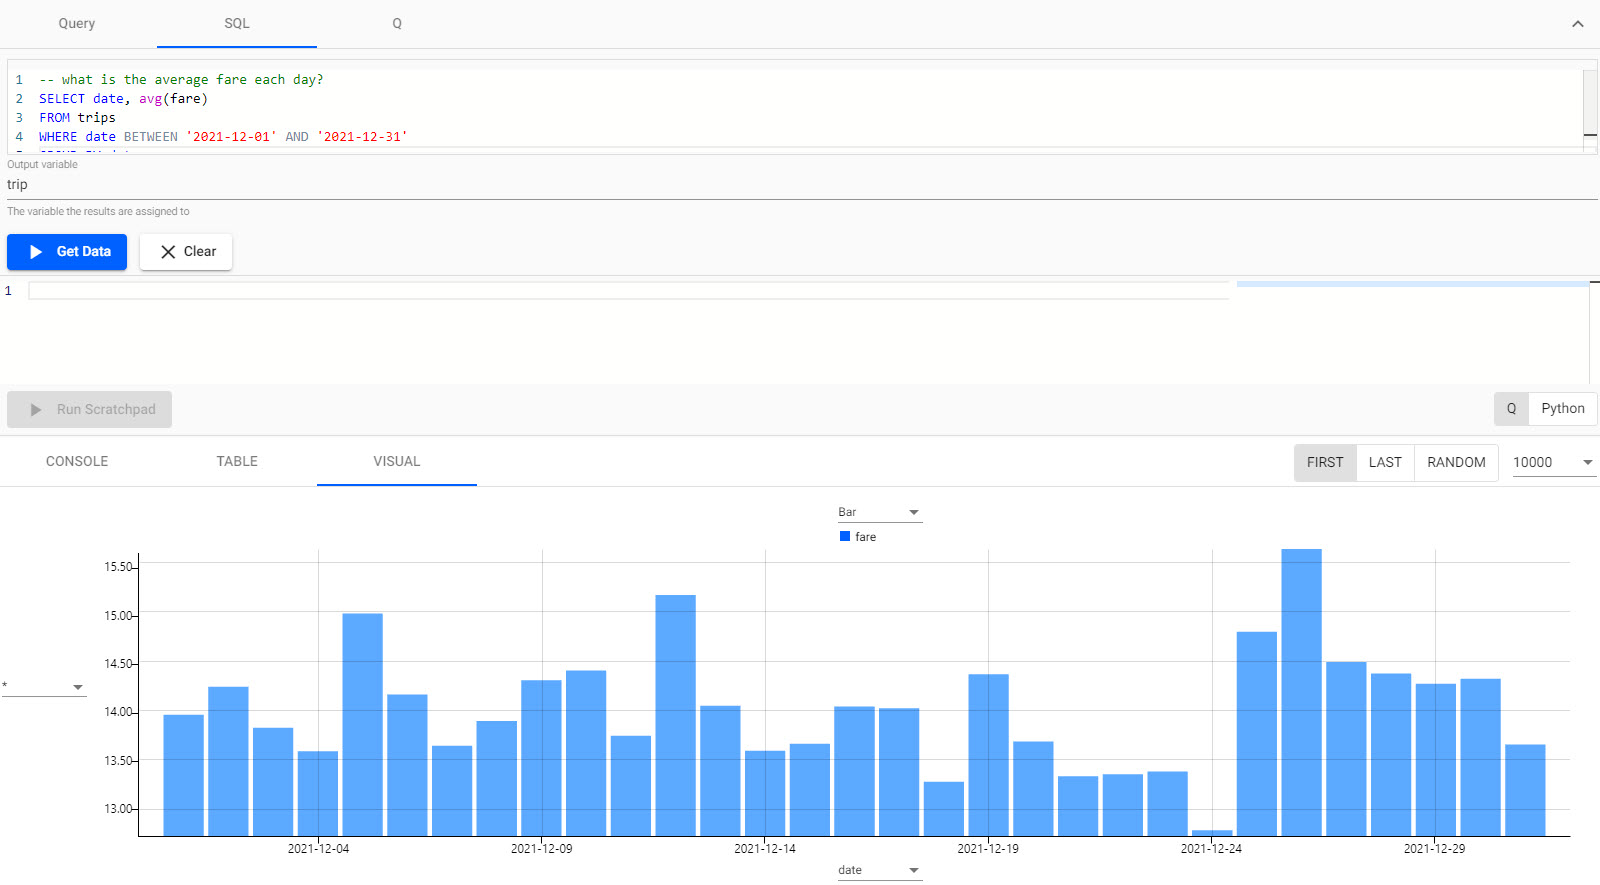
Daily average fare using SQL.
Select database=taxi and instance=hdb.
// what is the average fare each day?
select avg fare by date from trips where date within (2021.12.01;2021.12.31)
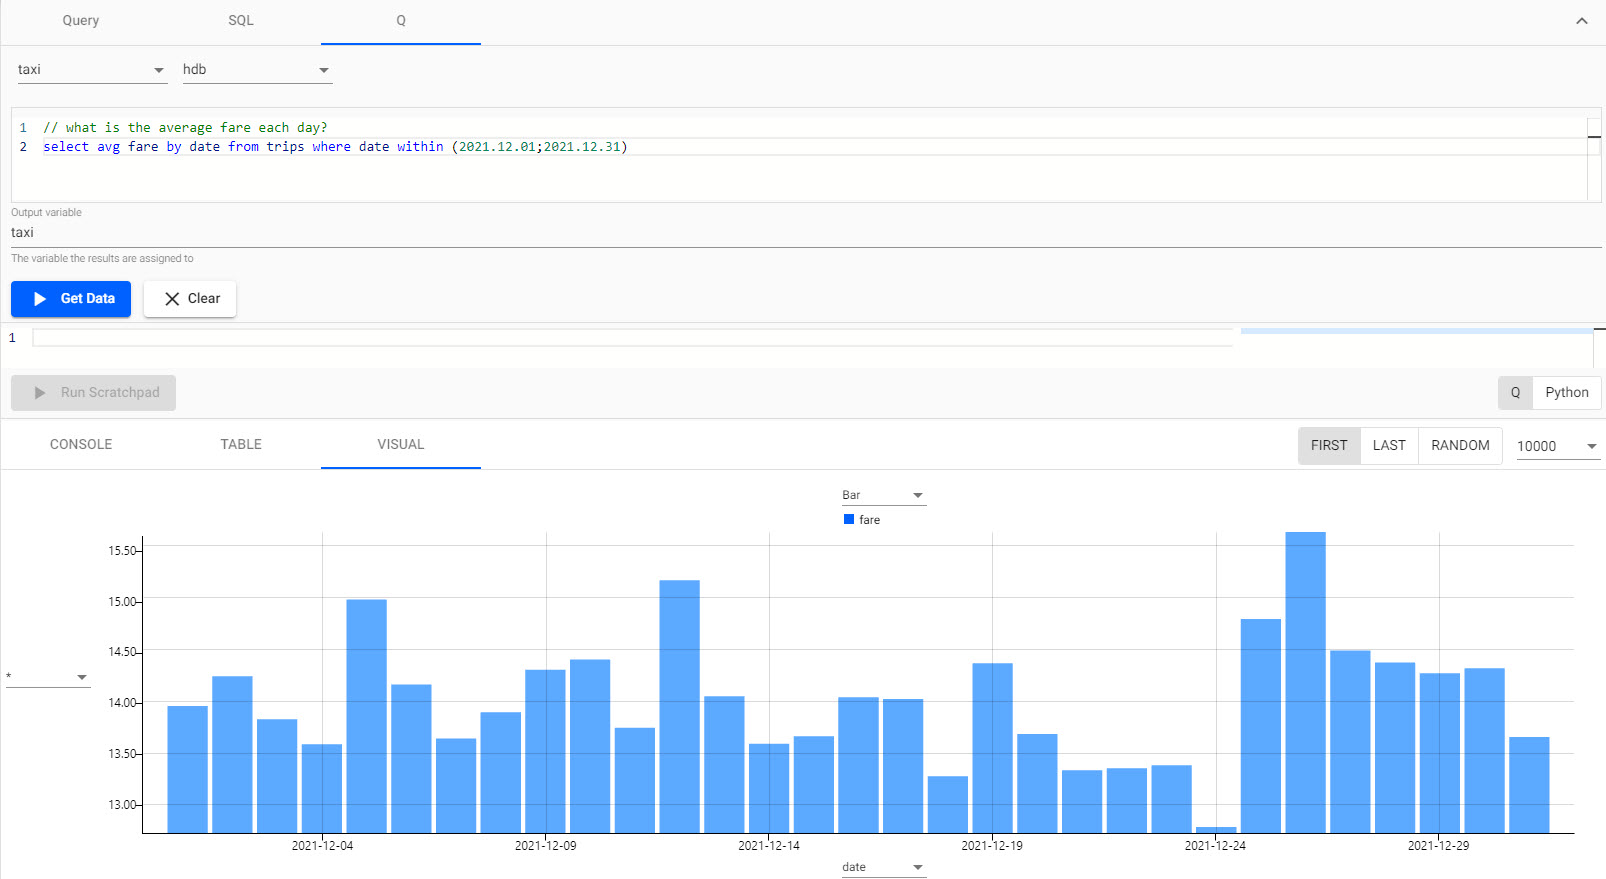
Daily average fare using q.
What is the average fare each day?
Again using the visual tab, it is clear the number of trips per day was lower around christmas, however, here also noticed that the average fare amount was actually higher for these days.
This analysis could help taxi companies see what days are most lucrative possibly indicating higher demand.
Hourly Passenger Count
Select database=taxi and instance=hdb.
// 1. group the pickup time into 60 minute buckets using xbar
// 2. get the average number of passengers for the trips in each bucket
select avg passengers by buckets:60 xbar pickup_datetime.minute from trips where date within (2021.12.01;2021.12.31)
Syntax explanation
The xbar function is used to group the data on the pickup datetime column into 60 minute buckets.
To assign the resulting buckets to a new column name in the resulting table, we simply use a colon :.
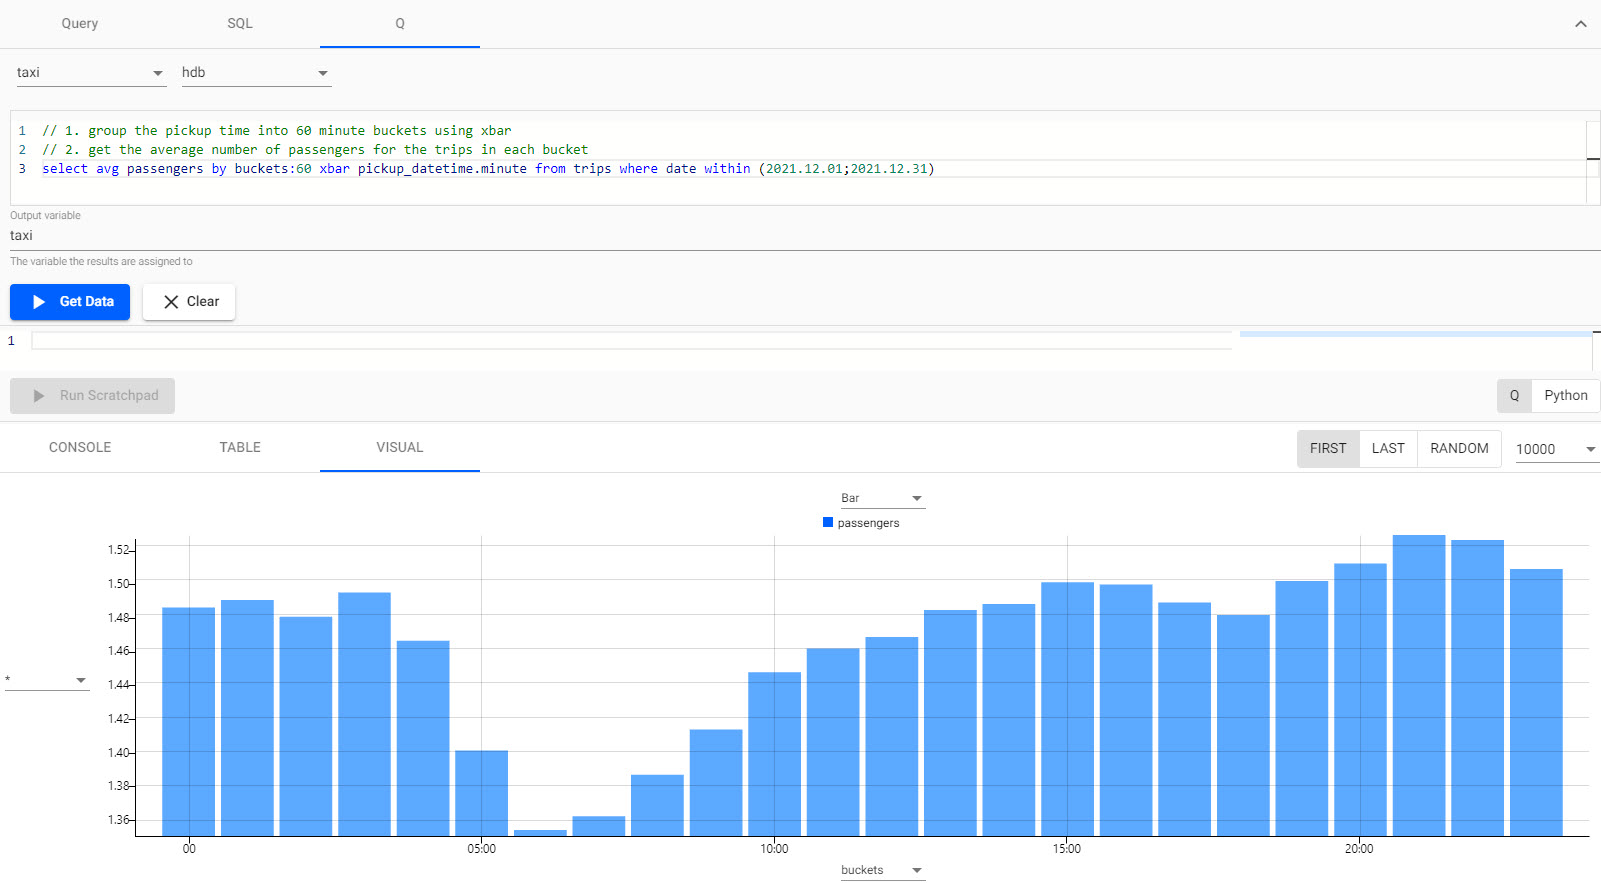
Hourly passenger count using q.
What is the average number of passengers per trip each hour?
It is clear that in the later hours of the day, trips have a higher average number of passengers than in the early morning hours.
This analysis could help taxi companies optimise the deployment of their drivers based on the seat capacity of the cars in their fleet.
Tipping Behavior
Select database=taxi and instance=hdb.
// what is the average tip for each 15-minute timespan?
select avg tip by buckets:15 xbar pickup_datetime.minute from trips where date within (2021.12.01;2021.12.31)
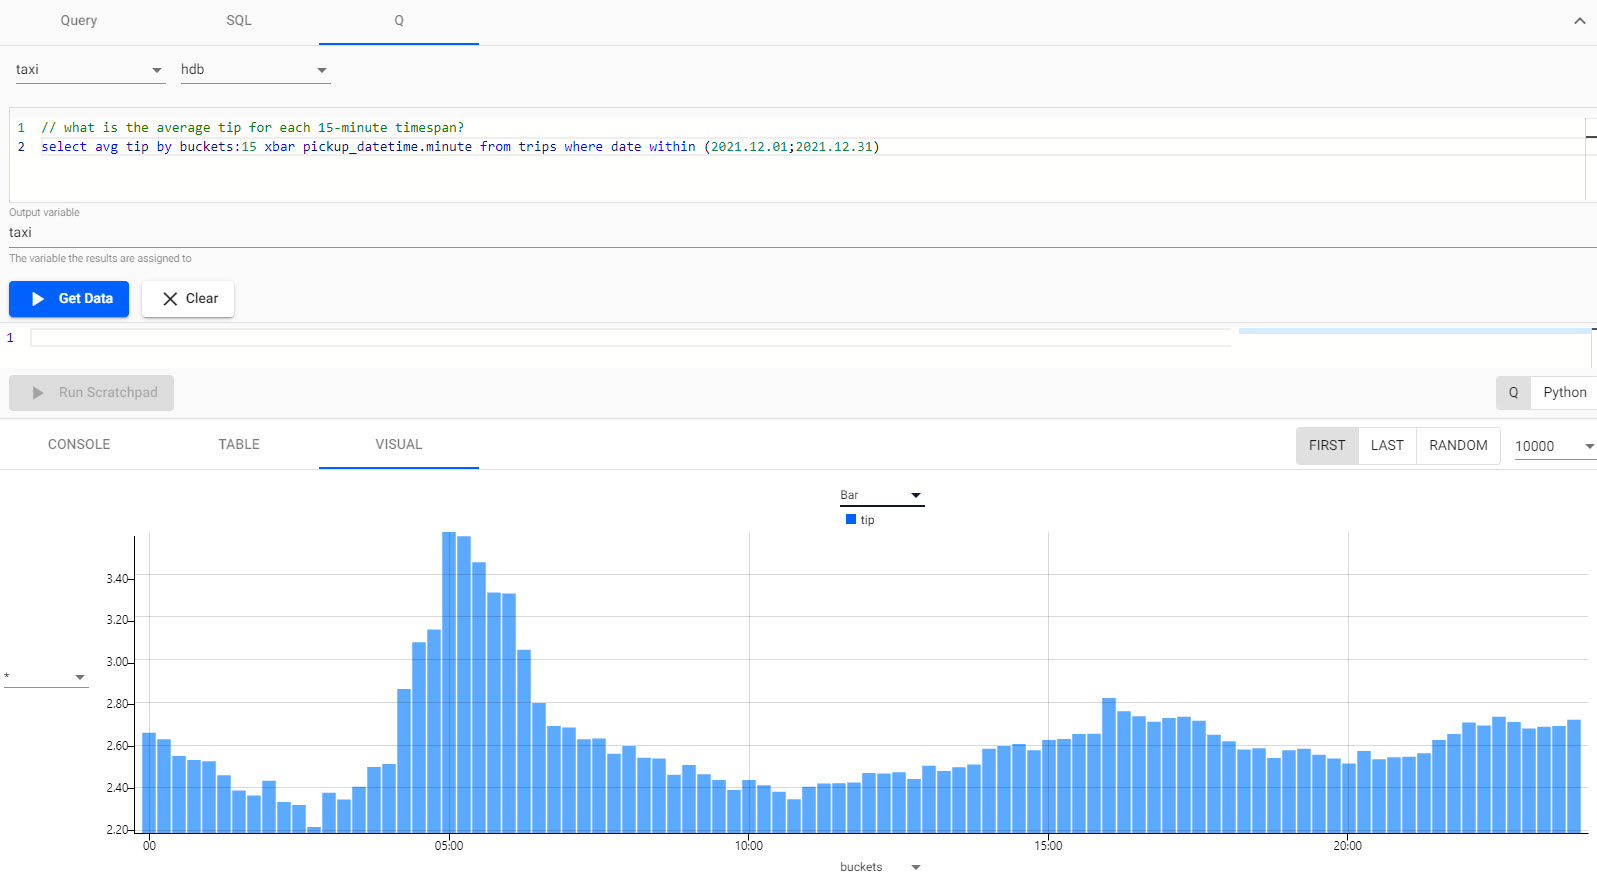
Tipping behavior run using q.
When are people giving the most tips?
Throughout the day, there is usually a consistent amount of tips, with a slight decline in the middle of the night. This decline is followed by a massive increase during the hours of 4am to around 7am.
This analysis could help taxi companies encourage their drivers to work shifts that include those early morning hours.
Compare Tips And Distance
For this example you can switch to the scratchpad for analyzing the extracted data in further detail.
-
Use Get Data to save the following query as a variable called
tip_buckets.Select
database=taxiandinstance=hdb.// get the average tips in 15 minute intervals 0!select avg tip by buckets:15 xbar pickup_datetime.minute from trips where date within (2021.12.01;2021.12.31) -
Use Get Data to save the following query as a variable called
distance_buckets.Select
database=taxiandinstance=hdb.// get the average distances in 60 minute intervals 0!select avg distance by buckets:60 xbar pickup_datetime.minute from trips where date within (2021.12.01;2021.12.31) -
In Scratchpad, select
Python. Add the followingPythoncode to the scratchpad editor:# join the tables 'tip_buckets' and 'distance_buckets' on the time column 'buckets' # this is joining tables with varying time granularity import pandas as pd pd.merge_asof(tip_buckets.pd(), distance_buckets.pd(), left_on="buckets", right_on="buckets")Cursor position for Python
You may need to move the cursor to the final line of code and run
Ctrl+Enterto visualize in Python. -
In the Visual tab, switch the chart type to
Line. -
Run Scratchpad
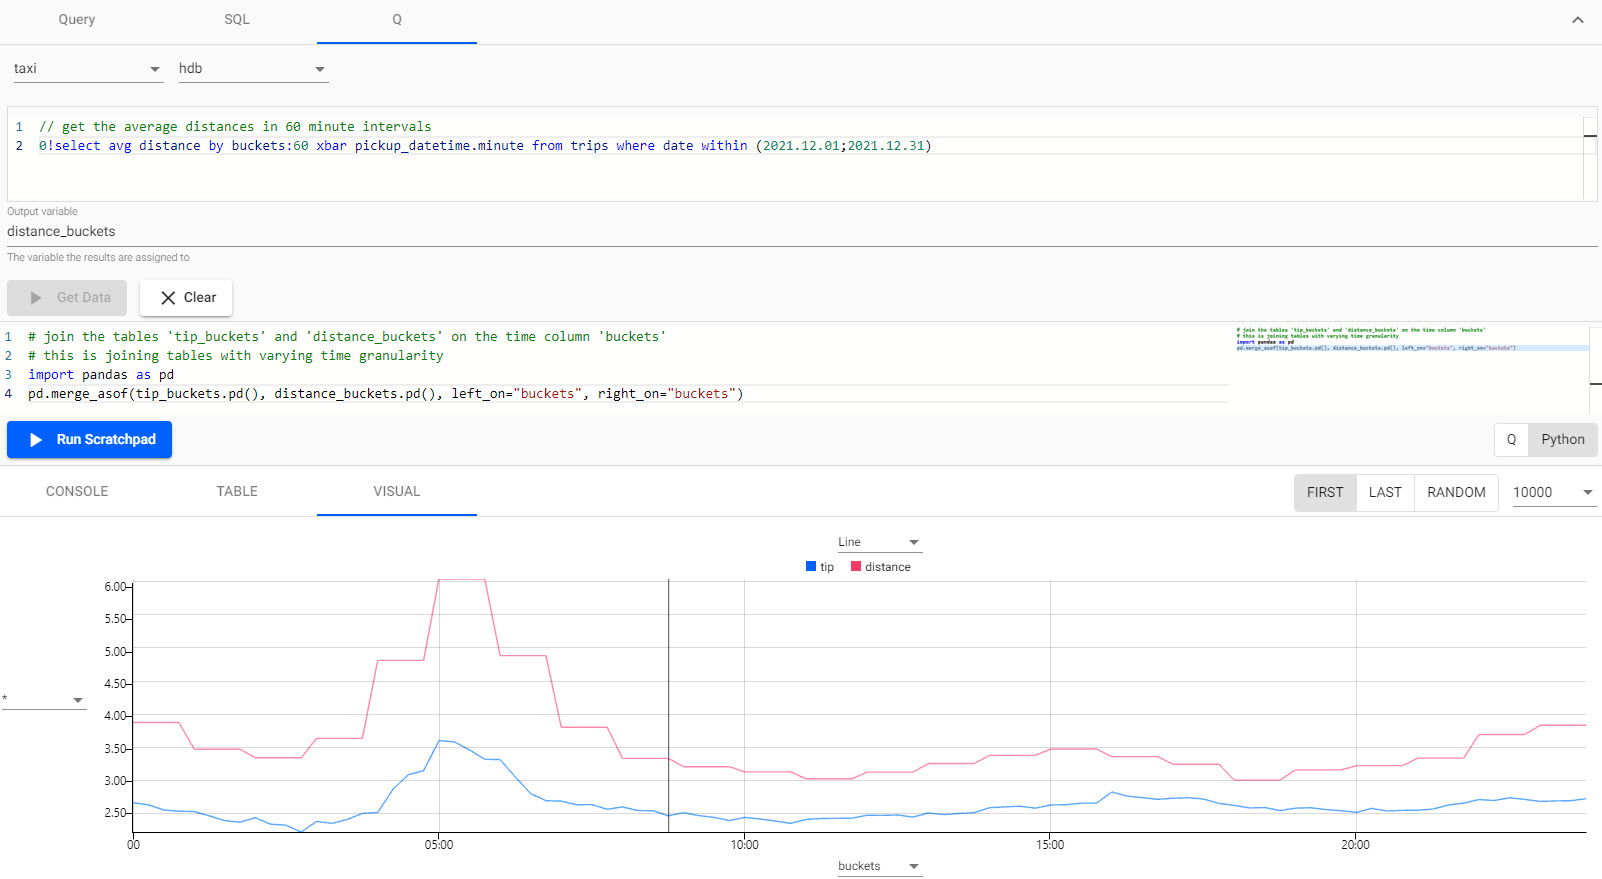
Line chart of tip and distance travelled as run inPythonusing the scratchpad.Syntax explanation
We need to import the
pandasmodule in order to access thepandas.merge_asoffunction to merge the tables together. When importing this module, we alias it aspd.This
pd.merge_asoffunction does not work on pykx tables so we need to convert this data structure into a pandas dataframe. This is done by calling the.pd()function on the pykx table.In this example, we use the
pd.merge_asoffunction to join two tables together of varying temporal granularity. -
The same output can be generated using
Qin the scratchpad:// join the tables 'tip_buckets' and 'distance_buckets' on the time column 'buckets' // this is joining tables with varying time granularity aj[`buckets;tip_buckets;distance_buckets]Syntax explanation
ajis a powerful timeseries join, also known as an asof join, where a time column in the first argument specifies corresponding intervals in a time column of the second argument.In this example, we use it to join two tables together of varying temporal granularity.
Does the distance of journey have an impact on tips earned?
It can be seen that trips that are a longer distance tend to earn higher tips for drivers.
This analysis might influence drivers to choose to take longer distance fares as they can earn a higher tip.
Breakdown Trips By Rate Type
Choose either SQL or Q:
-- how many trips fell under each rate type?
SELECT rate_type, COUNT(*) AS num_trips
FROM trips
WHERE date BETWEEN '2021-12-01' AND '2021-12-31'
GROUP BY rate_type
ORDER BY num_trips
Select database=taxi and instance=hdb.
// how many trips fell under each rate type?
`num_trips xdesc select num_trips:count i by rate_type from trips where date within (2021.12.01;2021.12.31)
How many trips occur for each area?
You can see here that the vast majority of trips fall into Standard rate with there also being a good number of trips falling under the airport rates JFK, Newark, and Nassau or Westchester.
This analysis could help taxi companies guage how many of the trips their drivers did of each rate type so they can manage the fare rates associated with each rate type.
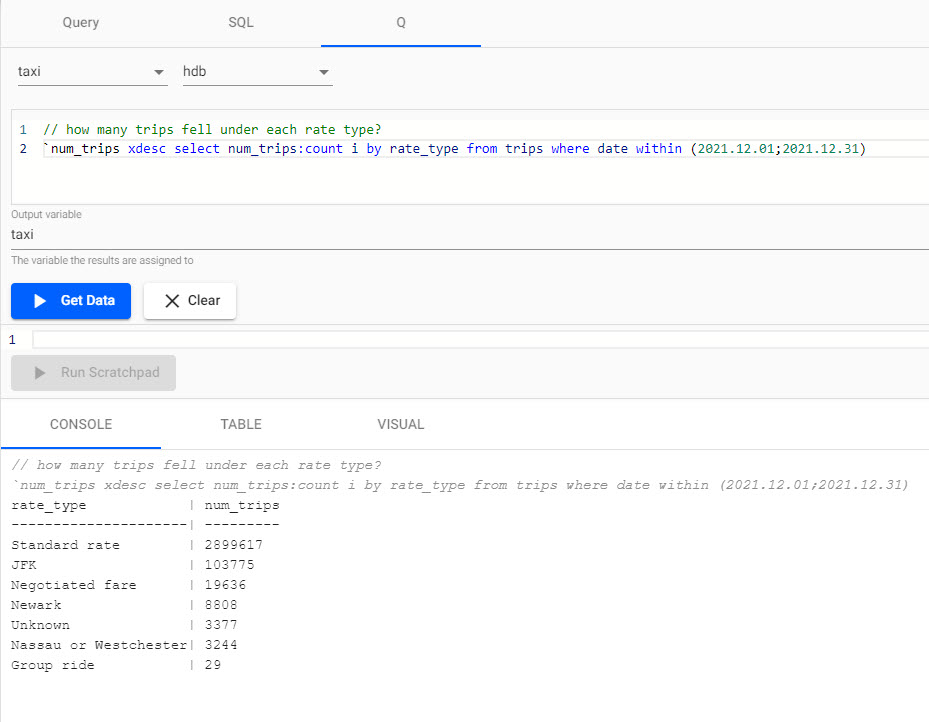
Number of trips under each rate type as generated by a q query.
Daily Airport Trips
Choose either SQL or Q:
-- how many trips to and from the airport were there each day?
SELECT date, rate_type, COUNT(*) AS num_trips
FROM trips
WHERE date BETWEEN '2021-12-01' AND '2021-12-31'
    AND rate_type in ('JFK', 'Newark', 'Nassau or Westchester')
GROUP BY date, rate_type
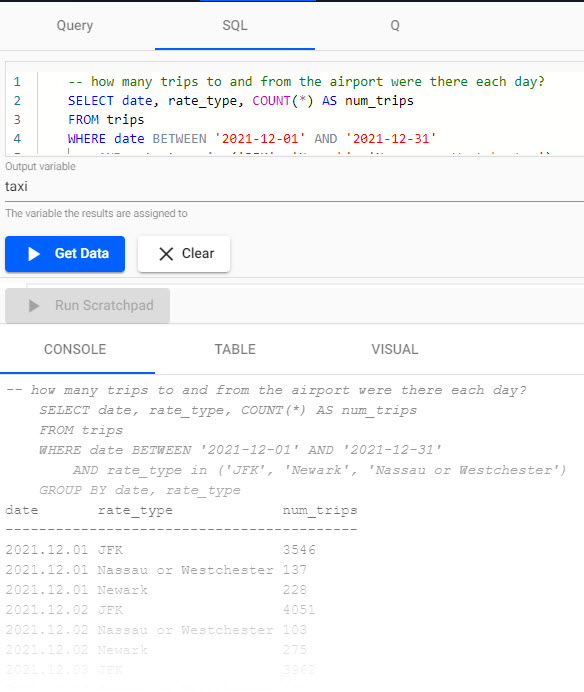
Number of daily airport trips as generated by a SQL query.
Select database=taxi and instance=hdb.
select num_trips:count i by date, rate_type from trips where date within (2021.12.01;2021.12.31), rate_type in `$("JFK"; "Newark"; "Nassau or Westchester")
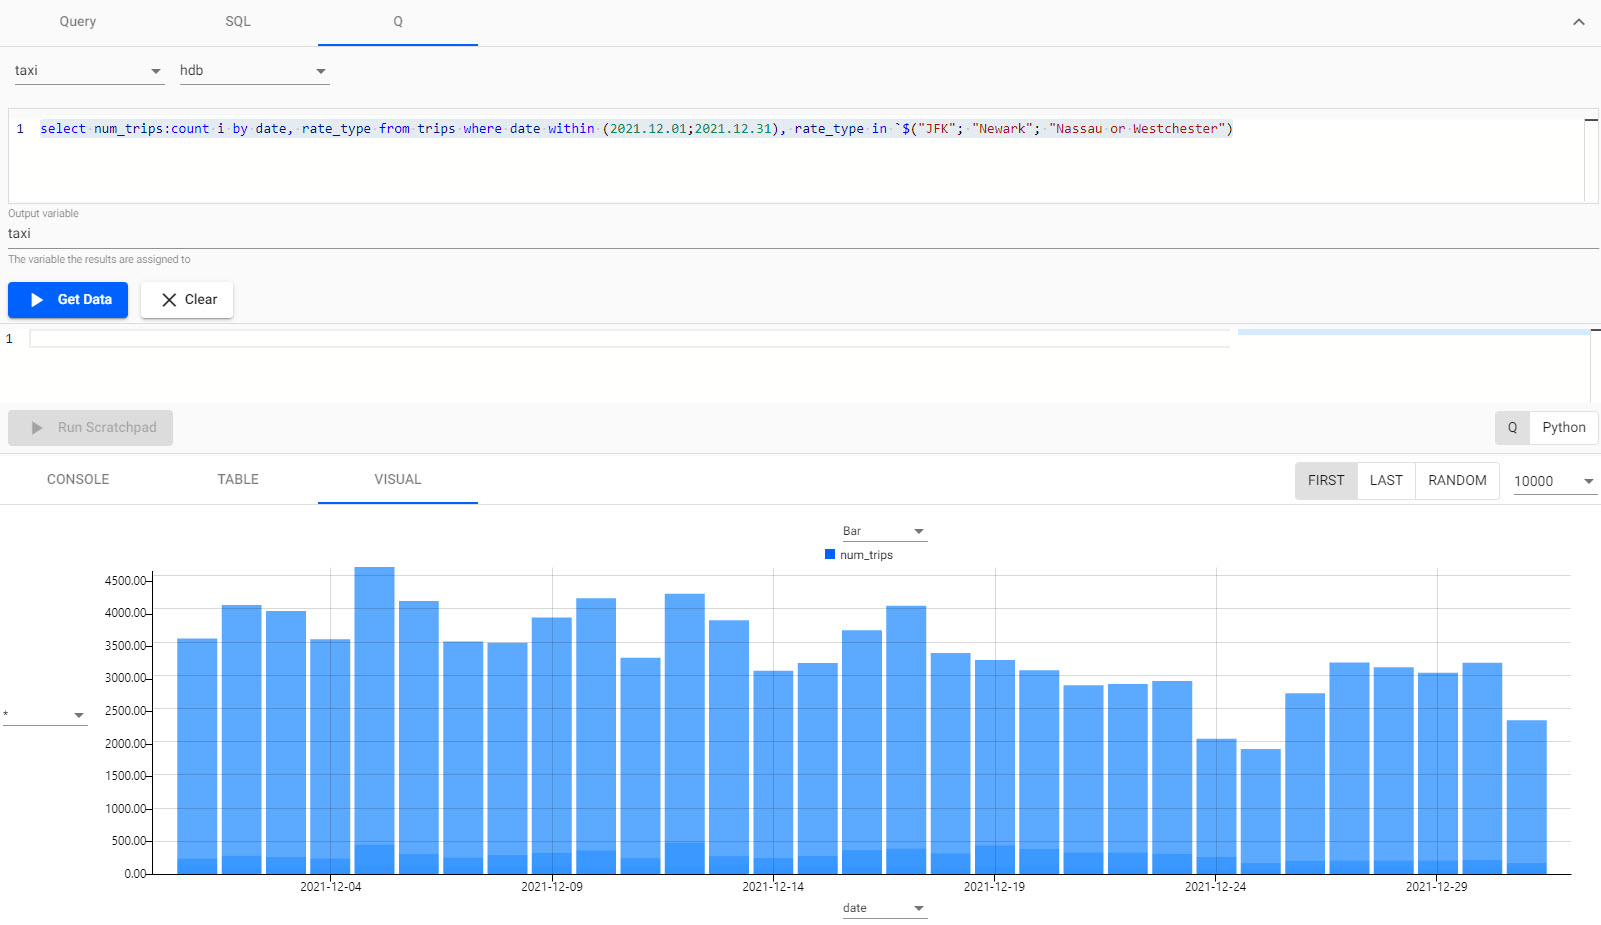
Number of daily airport trips as generated by a q query.
How many trips to and from the airport were there each day?
You can see here that the number of trips to and from the airport was relatively constant and that christmas had a minimal effect on the daily airport journeys.
This analysis could help taxi companies ensure that they have enough drivers working during this period despite the holidays.
Timestamp data for Trip data
If using the Query get data filters, the taxi data covers the period from 2021.12.31D00:00:00.000000000, for duration of the day.
What Next?
- Learn how to build databases and pipelines to injest data, query your data, then visualize using the Guided Walkthrough.
- Build a real-time trading application or learn how to apply predictive analytics for manufacturing using the Industry Tutorials.