UI
Visualizing in Query
Ad-hoc queries run in scratchpad can be visualized in one of a console, table or chart.
Scratchpad
Query the output variable generated by the database query with either kdb+/q or python. If using python, only the first line of code is processed. Standalone code can also be run in the scratchpad.
 , or the keyboard shortcut of CTRL + Enter, or ⌘Enter on Mac to execute code.
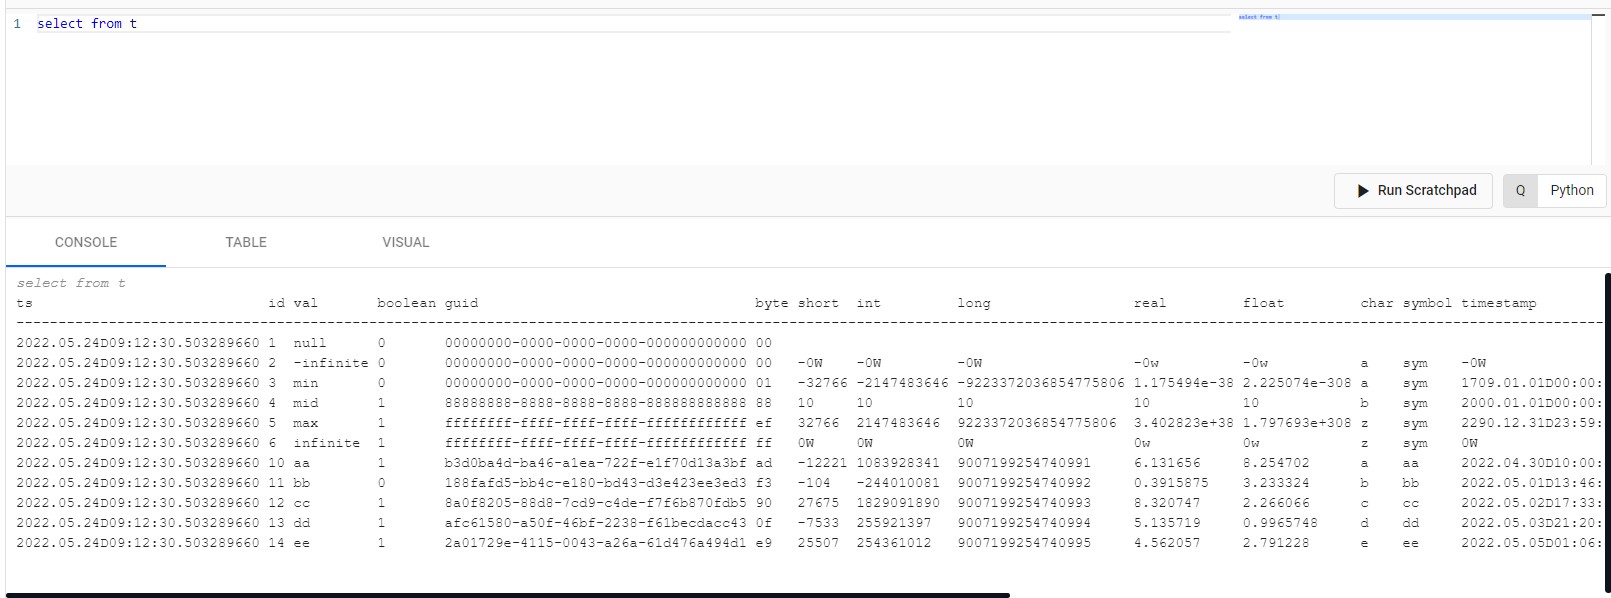
Console populated by a scratchpad query run against an output variable, 't', defined by Get Data
Running Queries
Running a selected line of code context is set by preceding lines, similar to \d .myContext or system "d .myContext". The global context is used in the absence of a preceding line.
Firefox Users
If you are unable to scroll in the scratchpad if using Firefox, check scrollbars are configured to be always visible.
Scratchpad Limitations
There is a (combined user) memory limit of 500MB for scratchpad queries. When exceeded, the scratchpad process shuts down and restarts. To optimize performance, limit the amount of data returned in your query; for example: select[10000] from myTable to return 10,000 rows of data.
After a scratchpad restart, earlier results are removed and are no longer available.
I want to learn more about querying the database.
I want to learn more about using q in my queries.
I want to learn more about using python in my queries.
Stream Processor
Scratchpad uses the Stream Processor (SP) to run pipelines. A scratchpad pipeline does not have to be deployed as for pipelines built with import or pipeline templates.
An expression pipeline built in scratchpad
This is how a sample stream processor expression pipeline looks in scratchpad:
pipelineA: .qsp.read.fromExpr["til 10"] .qsp.write.toVariable[`outputA];
pipelineB: .qsp.read.fromExpr["`a`b`c"] .qsp.write.toVariable[`outputB];
.qsp.run (pipelineA; pipelineB)
Running pipeline(s) can be torn down in the scratchpad with:
.qsp.teardown[]
Stream Processor pipelines
Pipeline(s) run in the scratchpad are not listed under Pipelines on the Overview page. Pipelines initiated in the scratchpad must be managed in the scratchpad.
Starting a pipeline with Stream Processor
View Data
Queried data is returned to the Console, Table or Visual. Run  on each console,table or visual tab switch to populate with data.
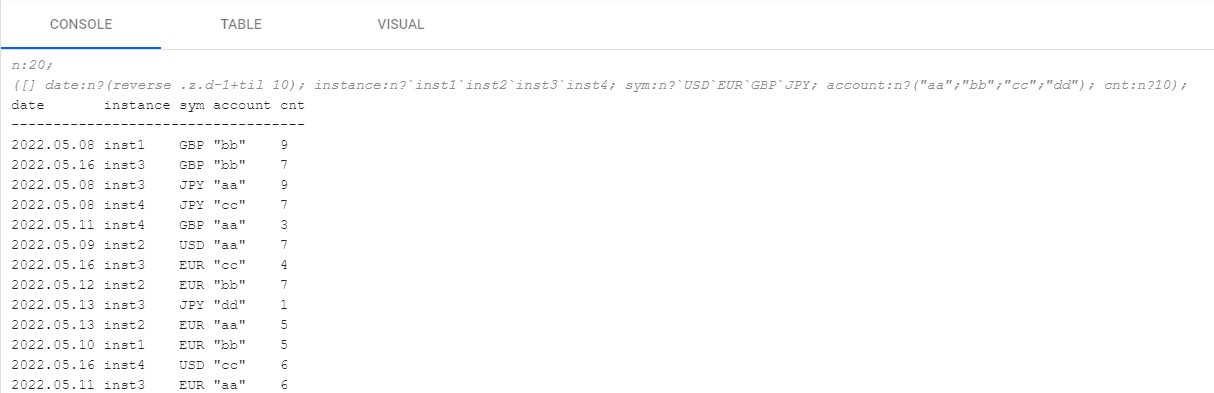
Console populated with data following an ad hoc scratchpad query.
Console
The console is the default display of data generated by a query. Right-click in the console for additional options.
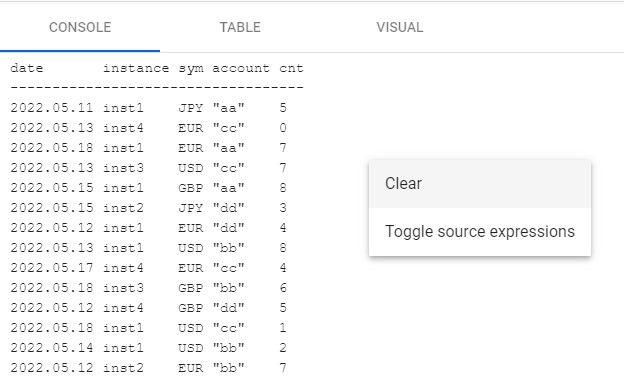
Console controls on right-click include clear and display code in console
| item | description |
|---|---|
| Clear | Clear the console |
| Toggle Source Expressions | Toggle the display of the code expression in the console. |
Table
Table is a more structured display of your data with additional filter options; results are paged.
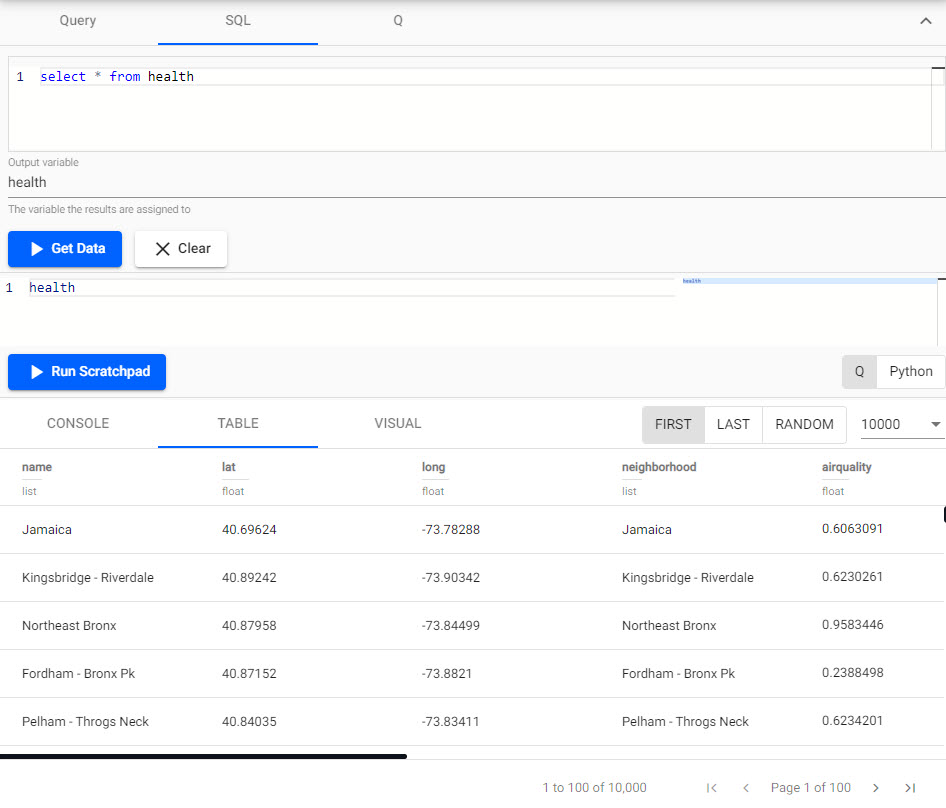
Tabulated output of a scratchpad query.
| item | description |
|---|---|
| First | Display results from the start of the data source (page 1). |
| Last | Display results from the end of the data source (last page). |
| Random | Select a random point in the data set to display results. |
| 10, 100, 1000, 10000 | Filter paged results by 10, 100, 1,000, or 10,000 results per page. |
Column Filter
Data columns can be sorted in ascending and descending order on a header click. Use AND/OR statements alongside operators contains, not contains, equals, not equal, starts with, or ends with for more comprehensive filtering - available from the "triple bar" menu.
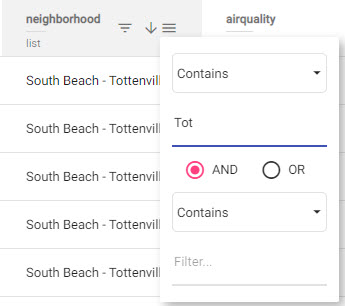
Column filter available on selection of "triple bar".
Visual
Visual plots data as a chart; choose between Bubble, Line or Bar and set the x- and y-axis from your data. For the y-axis, the default is set to wildcard *, which plots all of your numeric data points.
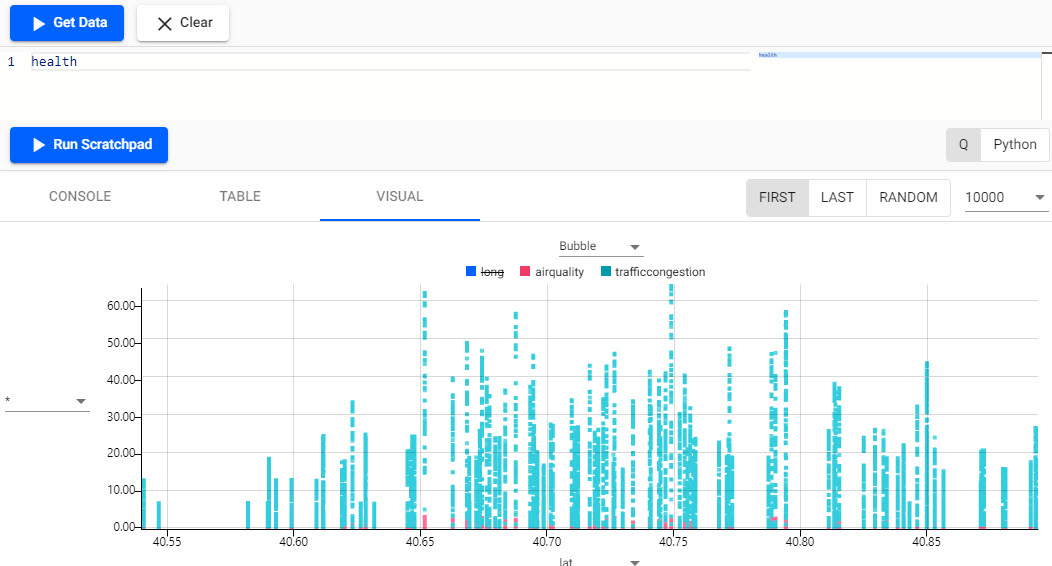
Bubble chart of health variables by latitude; airquality and traffic congestion.
| item | description |
|---|---|
| First | Display results from the start of the data source (page 1). |
| Last | Display results from the end of the data source (last page). |
| Random | Select a random point in the data set to display results. |
| 10, 100, 1000, 10000 | Filter paged results by 10, 100, 1,000, or 10,000 results per page. |
Chart Properties
Left-click anywhere in the chart header - except the dropdown menu - to enable the chart properties menu.
Display
Menu options are conditional based on the chart type you select.
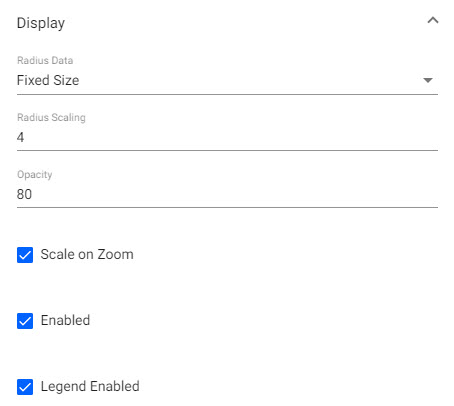
Display menu of custom properties.
| item | description |
|---|---|
Radius Data (Bubble chart only) |
Choose between a data source variable or Fixed sized bubbles. |
Radius Scaling (Bubble chart only) |
Set bubble size. |
| Color | Set the color of the bubble, bar or line. |
| Opacity | Set the opacity of the bubble, bar or line; range 0 (transparent) to 100 (opaque). |
Fill (Line chart only) |
Enable to fill the area of the line to the origin of the x-axis. |
Scale on Zoom (Bubble chart only) |
Enable for bubbles to scale on zoom - increase in size on zoom in, decrease on zoom out. |
Bar Percentage (Bar chart only) |
Toggle between Percentage or Fixed Width for bar width. |
| Enabled | The chart layer displays on the chart. |
| Legend Enabled | Enable for chart legend to appear above the chart |
Color Palette
Set color for layers when wild card is used to plot data; expand the dropdown for each data layer.
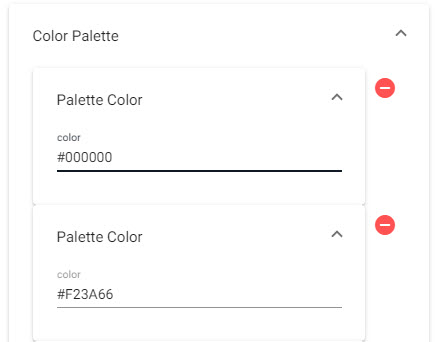
Color palette used for wildcard layers; defined using a Hex color.
Sidebar chart properties
Use the drag-bar to reveal hidden chart properties if not already visible.
Animation
Set animation for what happens when layers are changed.
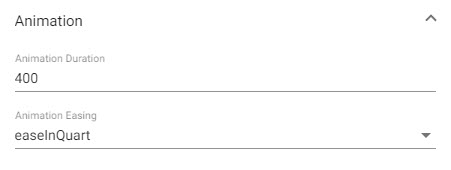
Custom animation for change of layers.
| item | description |
|---|---|
| Animation Duration | Set the time in milliseconds for animation duration. |
| Animation Easing | Choose animation behavior: swingFromTo, swingFrom, swingTo, easeFromTo, easeFrom, easeTo, easeInQuad, easeOutQuad, easeInOutQuad, easeInCubic, easeOutCubic, easeInOutCubic, easeInQuart, easeOutQuart, easeInOutQuart, easeInQuint, easeOutQuint, easeInSine, easeOutSine, easeInOutSine, easeInExpo, easeOutExpo, easeInOutExpo, easeInCirc, easeOutCirc, easeInOutCirc, easeOutBounce, easeInBack, easeOutBack, easeInOutBack, bounce, bouncePast, elastic. |
Overlay
Define crosshair and overlay behaviors
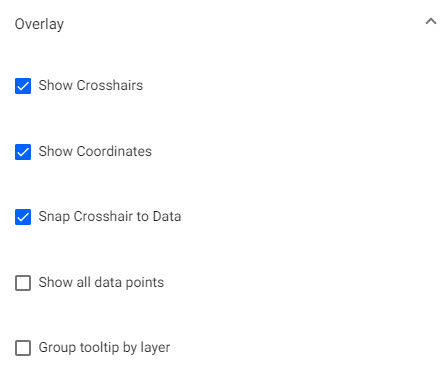
Display overlay menu properties.
| item | description |
|---|---|
| Show Crosshairs | Adds a crosshair to the chart. |
| Show Coordinates | Displays axis values for cursor position in chart. |
| Snap Crosshair to Data | Crosshair position locks to y-axis value relative to x-axis postion. |
| Show all data points | Crosshair displays all values in tooltip at x-axis position. |
| Group tooltip by layer | Group display of chart values in the tooltip by data layers. |
X- and Y-Axis
Define data variables to chart. Click area above and below y-axis dropdown - or left and right of x-axis dropdown - to open axis property menus.
| item | description |
|---|---|
| Number of Ticks | Define number of tick labels to display in the x- or y-axis. |
Range
| item | description |
|---|---|
| Use min max | Enable to use min/max axis range |
| Min | Set minimum value for the axis |
| Max | Set maximum value for the axis. |
Gridlines
| item | description |
|---|---|
| Offset Gridlines | When enabled, sets gridlines between tick values. |
| Gridlines Color | Set the color of the gridlines used in the chart. |
| Gridlines Opacity | Defines the opacity of gridlines from 0 (transparent) to 100 (opaque). |
Format
| item | description |
|---|---|
| Display | When enabled, displays tick values. |
| Begin at Zero | When enabled, plotted values start at 0 for the y-axis. |
| Numeric Format | Select between Number, Smart Number and Formatted Number. |
| Decimal Places | Define precision of y-axis labels. |
| Font size | Define font-size of tick labels. |
| Prefix | Add a text element before the y-axis label. |
| Suffix | Add a text element after y-axis tick label. |
| Hide Trailing Zeroes | When enabled, hides trailing zeroes from axis label. |