Quick Start
Build visuals with kdb Insights Enterprise views
1. Open a view
Create a view with Visualize from "Discover kdb Insights Enterprise" of the Overview page, or open an existing view from the left-hand menu. Ensure you have an active database with data to populate a dashboard view.
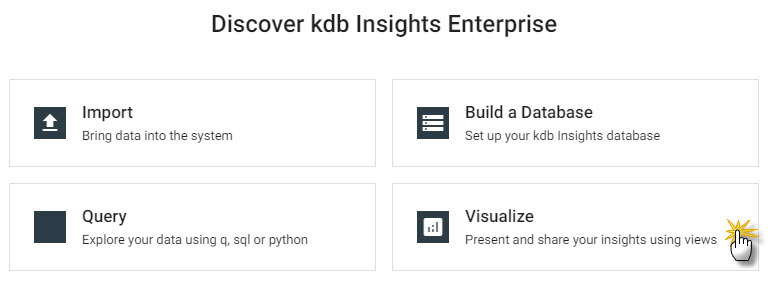
Create a view from Visualize of "Discover kdb Insights Enterprise".
2. Click-and-drag a component into the central workspace
Select a component from the list of icons inside the view workspace; the top component, data grid, is a good component to start with.
Click-and-drag a component into the workspace.
3. Click to populate Data Source
Add data to the component - click the interactive element, "Click to populate Data Source", inside the selected component to open the data editor.
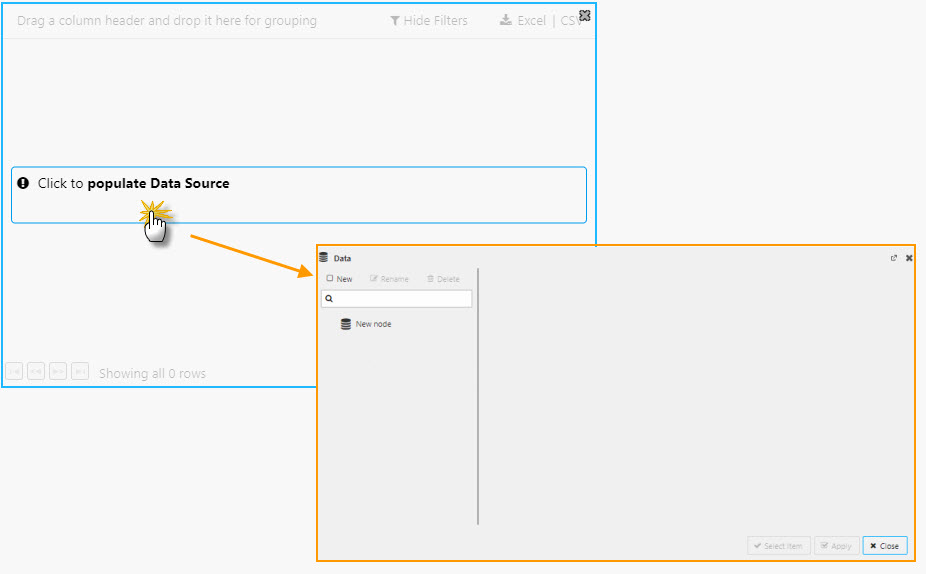
Click to populate Data Source to open the data editor.
4. Create new data source
Create a New data source and choose between the getData API query filter, SQL or q editor. Create a query to return data to the component. If new to kdb Insights Enterprise, start with the getData API query.
5. Customize the data view
Format the data inside the component; add colors, highlight rules, actions and/or filters.
See custom component examples of guided walkthrough.
6. Add a new component
Add new components and data queries - continue to build the dashboard view.
7. Save and share
Save the view and share the URL link with friends and colleagues.
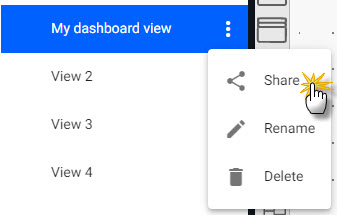
Open a share dashboard view link from the triple dot menu.