kdb Insights Enterprise Azure Monitoring Workbooks
kdb Insights Enterprise on Azure Workbooks are a compilation of relevant metrics to help the user monitor the performance and status of the kdb Insights Enterprise system and the Azure Cloud infrastructure in a centralized and holistic way.
Azure Workbooks are based on Microsoft Azure log analytics data, a feature that allows you to obtain performance statistics from the system, while offering a tight integration across the Microsoft supported deployments.
The kdb Insights Enterprise Workbooks are automatically deployed alongside each kdb Insights Enterprise instance to assist with monitoring the performance and health of the system.
Getting started
-
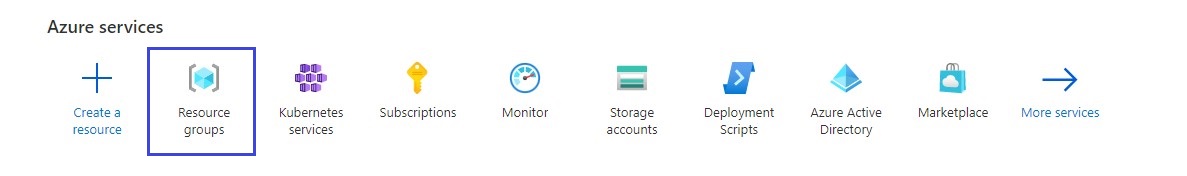
Go to Azure Homepage and click Resource Group
-
Select kdb Insights Enterprise Workbook
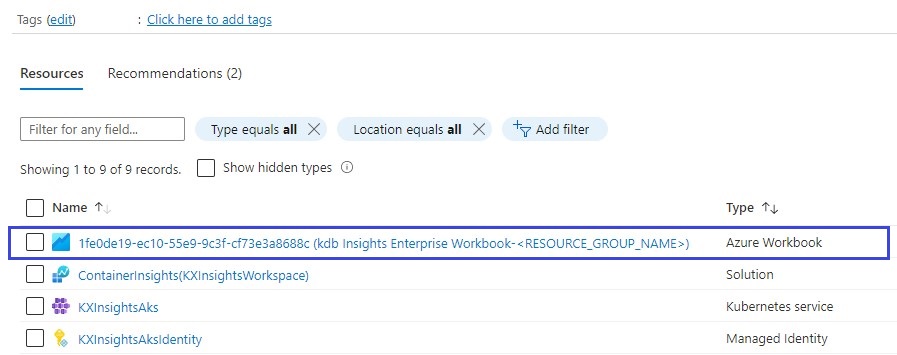
Workbook naming convention
The naming of your Workbook consists of ("kdb Insights Enterprise Workbook"-"Name of the Resource Group where it is deployed").
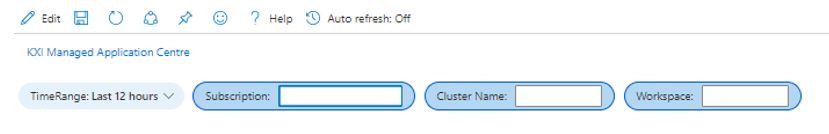
Navigate the Workbook
Given its multi-deployment tracking capability, you can navigate through Subscriptions without changing the screen.
You need to select Subscription, Cluster Name, Workspace and Time-Range.
-
Make your selection on the main tab.
A set of tabs below helps you navigate each metric category.
-
Make your selection on the sub tabs

Tabs
Cluster overview
Metrics shown on this tab provide a general health overview of Azure and the kdb Insights Enterprise underlying hardware. It provides Kubernetes cluster-level overview of CPU memory and disk usage.
| metric | description | recommendation to maintain a healthy system |
|---|---|---|
| Cluster Max CPU | Percentage of cluster's CPU utilised by kdb Insights Enterprise. | Keep CPU < 95% to prevent system failure. |
| Cluster Memory Used | Percentage of cluster's available RAM Memory utilised by kdb Insights Enterprise. | Keep RAM < 95% to prevent data loss. |
| Disk Usage % (rook-ceph) | Percentage of cluster's available Disk utilised by kdb Insights Enterprise. | Keep Disk < 95% to prevent data loss. |
Nodes
Information shown on this tab contains details for nodes that are part of that particular Kubernetes cluster, with each node being a virtual or a physical machine. It can be identified as “kxinsightaks” – kdb Insights Enterprise Azure Kubernetes Service.
| metric | description | recommendation to maintain a healthy system |
|---|---|---|
| Total Node Count | Total Amount of Nodes deployed in the Cluster. | It depends on the use-case. |
| Node Status | Amount of Nodes deployed in the Cluster by their health status. | All nodes should be in Ready status. It indicates Nodes are healthy and ready to accept pods. |
| Max CPU Usage (%) by Node of Total Capacity | Max Percentage of CPU Utilised to run the system and functions. | Keep CPU < 95% to prevent system failure. |
| Max Memory Usage (%) by Node of Total Capacity | Max Percentage of Memory RAM utilised to run the system and functions. | Keep RAM < 95% to prevent data loss. |
| Max Disk Usage (%) by Node of Total Capacity | Max Percentage of Disk utilised to store ingested data. | Keep Disk < 95% to prevent data loss. |
Network
| metric | description | recommendation to maintain a healthy system |
|---|---|---|
| Node Network Bytes In | Amount of data received through the network (download). | It depends on the use-case. |
| Node Network Bytes Out | Amount of data sent through the network (upload). | It depends on the use-case. |
| Node Errors In Per Second | Amount of failed attempts of one host when trying to communicate with another host/server when receiving data (download). | Should be as close to 0 as possible. |
| Node Errors Out Per Second | Amount of failed attempts of one host when trying to communicate with another host/server when sending data (upload). | Should be as close to 0 as possible. |
| Node Received Bytes/sec | Rate at which data is received. | Large peaks would indicate high speed connection. Please compare it with the usual network behavior characteristics. |
| Node Sent Bytes/sec | Rate at which data is sent. | Large peaks would indicate high speed connection. Please compare it with the usual network behavior characteristics. |
Disk
| metric | description | recommendation to maintain a healthy system |
|---|---|---|
| Node Disk Busy % (Max) | Utilization of Disk by transactions and access requests. | It can go up to 100% for a few seconds or minutes, but it should settle < 90% to prevent lagging/slow response. |
| Node Disk Bytes Read Per Second | Data read from disk. | It depends on the use-case. Throughput is determined by workload and the available storage performance. |
| Node Disk Bytes Written Per Second | Data written down to Disk. | It depends on the use-case. Throughput is determined by workload and the available storage performance. |
| Disk IOPs (Max) | Input/Output operations that are in progress of execution. | It depends on the use-case. |
| % Used Disk of Nodes | List of most used Nodes by percentage capacity. | It should be < 90%. |
Pods
Pods are a group of one or more running containers (containers can run one or more processes). Information shown on this tab relates to the pods of both the kdb Insights Enterprise deployment and Azure Kubernetes (AKS).
AKS relies on controllers to monitor and manage pods and to coordinate resources for software applications. Namespaces provide a mechanism for isolating groups of resources within a single cluster. Names of resources need to be unique within a namespace, but not across namespaces. Namespace-based scoping is applicable only for namespaced objects (e.g. Deployments, Services, etc) and not for cluster-wide objects (e.g. StorageClass, Nodes, PersistentVolumes, etc).
| metric | description | recommendation to maintain a healthy system |
|---|---|---|
| CPU Cores Used by Container | CPU being used by every container. | CPU spikes could indicate container and process may be misfunctioning. |
| Memory Used by Container | Memory used by every container. | Memory=0 could indicate container and process are offline. That could lead to data traffic back-up. |
| Pod Count | Amount of Pods in total being deployed in the cluster. | It depends on the use-case. |
| Pods per Node | Amount of Pods deployed in each node. | Should always be > 0 |
| Namespace Count | Amount of different Namespaces in the cluster. | It depends on the use-case. |
| Pods per Namespace | Amount of Pods inside each Namespace. | It depends on the use-case. |
| Pods by Node | List of all the pods and their Namespace and status (Running, Succeeded, Pending, Failed, Unknown) within each Node. | It depends on the use-case. |
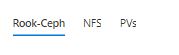
Disks
Note
These charts are only populated based on your choice of storage. If Rook-Ceph deployment was not manually selected during the kdb Insights Enterprise's configuration, the default storage class is Azure NFS.
Rook-Ceph
Information shown on this tab relates to Rook-Ceph, a storage management tool used on Kubernetes. It automates the storage management processes of the system, making storage self-healing, self-managing and self-scaling.
Rook-Ceph uses Object Storage Daemons (OSDs) to manage devices and ensure data can be accessed and relies on Pools to obtain resilience to data loss and also uses Objects to store data.
| metric | description | recommendation to maintain a healthy system |
|---|---|---|
| Cluster State | System’s health status: Healthy, Warning, Error. | Cluster should appear as Healthy. |
| Number of OSDs | Quantity Object Storage Daemons deployed on Ceph. | It depends on the cluster setup. |
| Number of OSDs Up | Amount of OSDs running. | If Number OSDs ≠ Number OSDs up, Cluster state changes status. |
| Number of Pools | Number of Pools deployed. | By default = 4. |
| Number of Objects | Number of Objects deployed. | It depends on the amount of ingested data. |
| Cluster Disk usage % | Percentage of Disk utilised. | Keep it < 95% to prevent data not being stored. |
| Read/Write bytes | Total amount of data written and read by the OSDs of Ceph. | It depends on the use-case. |
| Read/Writes | Number of read and write operations. | It depends on the use-case. |
| Pool stored % | Disk space by Pool. | Keep it < 95% to prevent data not being stored. |
| Pool Stored bytes written | Rate at which each Pool writes data. | It depends on the use-case. |
| Pool Stored bytes read | Rate at which data is read. | It depends on the use-case. |
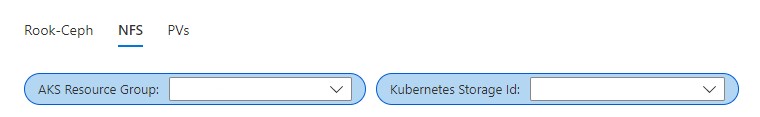
Azure NFS
Information shown on this tab relates to Azure NFS.
In order to load the metrics, you'll have to select the respective Resource Group AKS and its connected storage ID.
| metric | description | recommendation to maintain a healthy system |
|---|---|---|
| Availability | Percentage of successful Billable Requests out of All applicable Requests in the storage. | If < 100%, it could indicate errors in storage service requests. |
| Transactions | Total amount of transactions executed by the Storage Account. | It depends on the use-case. |
| Success E2E Latency | End-to-End latency of successful requests made to a storage service. | It depends on the type of data being ingested and nature of use-case. |
| Success Server Latency | Latency used by Azure Storage to process a successful request. It does not include the network latency specified in Success E2E Latency. | It depends on the type of data being ingested and use-case. |
| Transactions by Storage Type | Total transactions executed by each storage type. | Expect values > 0 in Storage types that have been configured. |
| Transactions by API Name | Total transactions executed by each API. | It depends on the configuration and use-case. |
| Availability by Storage Type | Percentage availability of the allocated storage by storage type. | It depends on the configuration and use case. |
| Used Capacity | Storage usage by storage type. | It depends on the configuration and use case. |
| Latency: End-End & Server | Total milliseconds of latency for E2E and Server. | Typically there is little gap between end-to-end latency and server latency. |
| Bandwidth | Ingress and Egress values. Ingress refers to all data that is sent to a storage account. Egress refers to all data that is received from a storage account. | Limit amounts of Ingress/Egress differ depending on the chosen storage type. |
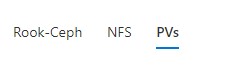
Persistent volumes (PV)
Information shown on this tab relates to the PV of either of the chosen storages.
| metric | description | recommendation to maintain a healthy system |
|---|---|---|
| PV States | Total amount of PVs by health state based on their percentage usage of their total capacity. | All PV should be in a healthy state. |
| Top 10 PVs usage % | List of the most used PV based on percentage usage of their total capacity. | Expected to be < 100%. |
| Used Space for Top 10 PVs | List of the PV by most memory used. | It depends on the use-case. |
Assemblies
This section is used to monitor data flow through each assembly in the kdb Insights Enterprise. An assembly is the entity that represents the resources needed to ingest data into the system, transform it and store it in the database. An assembly includes a schema and a database, alongside one or more streams and pipelines.
This tab provides information about the volume of data and number of messages flowing through each assembly. It also provides lower-level details about the messages/sec, bytes/sec and the average message size per Assembly and Stream. A stream, also known as a Reliable Transport (or RT), is a component which transports data into the system and between components of the application.
All assemblies view
| metric | description | recommendation to maintain a healthy system |
|---|---|---|
| Stream Messages In bytes/sec | Rate at which data is passed into a Stream at a given time. This may be from an external source, or from a Stream Processor. | It depends on the use-case. |
| Stream Messages Out bytes/sec | Rate at which data is passed out of a Stream. This may be to the Stream Processor or the Storage Manager. | Data is expected to flow through a Stream. If incoming data is happening, Stream Messages Out/bytes should > 0. |
| Streaming Messages In DB/sec | Rate of data flow from a Stream into the database. | It depends on the use-case. |
Stream details
| metric | description | recommendation to maintain a healthy system |
|---|---|---|
| Stream Messages In bytes/sec | Rate at which data is passed into a Stream at a given time. This may be from an external source or from the Stream Processor. | It depends on the use-case. |
| Stream Messages In/sec | Total number of messages being passed through a Stream. | Stream Messages In could differ from Stream Messages Out, if data filtering or other logic that transforms the data is in place. |
| Average Size of Messages in bytes | Stream Messages Out bytes/sec. Rate at which data is passed from the Stream Transport (RT) to kdb Insights Enterprise or the Storage Manager. | If Stream Messages Out ≠ Stream Messages In data may be trapped. |
| Stream Messages Out/sec | Rate at which data is passed out of a Stream. This may be from to the Stream Processor or the Storage Manager. | Data is expected to flow through the Stream. Rate of "Stream Messages Out" may differ from the rate of "Stream Messages In" only if filtering rules are in place to filter out certain messages. |
| Average Size of Messages Out bytes | Average size of each message flowing through a Stream. | Streams can differ based on their nature, it depends on the use-case. Expect value to be similar to Avg Size Messages in bytes, unless filtering rules are in place to filter out certain message content. |
Database tier details
Quick summary of the amount of data being passed from the Stream into the Database Tier.
| metric | description | recommendation to maintain a healthy system |
|---|---|---|
| Total Records getting in DB/sec | Rate of all the Records entering the database. | It depends on the use-case. |
| Total Messages getting in DB/sec | Rate of all the Messages entering the database. | It depends on the use-case. |
| Records per message | Total records contained in each message. | It depends on the use-case. |
DB ingestion
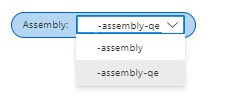
This section provides a deeper look into how data is passed through the different database tiers. It gives you the option to retrieve monitoring information from the Production Environment or the Query Environment (identified as "qe").
Real time stream
This tab depicts the number of data messages received by each tier from a Stream.
| metric | description | recommendation to maintain a healthy system |
|---|---|---|
| Message rate entering RealTime DB tier | Total Messages entering the real time database tier. | It depends on the use-case. |
| Message rate leaving RealTime DB tier | Total Messages leaving the RealTime tier to Intra-day (IDB) or Historical (HDB). | It depends on the use-case. |
Note
It is expected that each tier receives the same number of messages.
Intraday
This tab depicts how data moves from a Real Time Database (RDB) to an Intraday Database (IDB). This occurs at regular intervals throughout the day, by default this occurs every 10 minutes.
During an End of Interval process (EOI), data for the last 10 minutes is transferred to the IDB, where it is persisted to disk temporarily. From the IDB data is then persisted to disk in a historical database (HDB) partition at the end of the day (EOD).
| metric | description | recommendation to maintain a healthy system |
|---|---|---|
| Duration of last EOI transition | Length of each End of Interval process. | It depends on the use-case and amount of data ingested, but it should be less than the amount configured for IDB (10min by default). |
| Records written during last EOI | Amount of data held in RDB that has been written to IDB during the last EOI. | If the data stream has a steady data flow then the number of written records between each transition should be consistent. |
Historical database
This tab depicts how the historical database grows with each End of Day process (EOD). By default this occurs once a day.
| metric | description | recommendation to maintain a healthy system |
|---|---|---|
| HDB Size | Current size of the HDB. | It depends on the use-case. |
| Number of HDB Partitions | Current number of partitions in HDB. | It depends on the use-case, by default 1 partition for every day of ingested data. |
| Records Written During Last EOD Transition | Amount of data transferred to the HDB during an EOD process | If the data stream has a steady data flow then the number of written records between each transition should be consistent. |
DB queries
Information about all queries requested by processes that are either internal or external to the platform. The workbook gives you the option to retrieve information from the Production Environment or the Query Environment (identified as "qe").
These queries are actioned by the following components: Resource Coordinator, Service Gateway and Aggregators.
Resource Coordinator
The Resource Coordinator takes each request and sends it on to each database tier that needs to provide data to return the results of the query.
The workbook gives you the option to select the Resource Coordinator type, which retrieves information from the Production Environment or the Query Environment (identified as "qe").
| metric | description | recommendation to maintain a healthy system |
|---|---|---|
| Request Completion Time | Speed at which the system completes requests. | An increase in this could indicate a number of things: large number of requests are being made causing the system to come under pressure, some requests are expecting a large volume of data, there is a resource issue in the system. |
| Queue Length | Total number of requests that are in queue with the resource coordinator and have not yet been processed. | If this is high, or is increasing the system is under pressure and requests are building up. |
| Connected Components | Shows the number of components connected to the Resource Connector, including DAPs and Aggregators. | DAPs and Aggregators show decline = a component and its respective functions are lost. |
| Retry Count | Number of retries for the requests. | If the retry count is not zero then resources could be under pressure, or an error is occurring when trying to run the request. |
Service Gateway
The Service Gateway bridges network access and external access requests.
The workbook gives you the option to select the Service type, which retrieves information from the Platform/Production Environment or the Query Environment (identified as "qe").
| metric | description | recommendation to maintain a healthy system |
|---|---|---|
| Connected Components | Number of components currently connected to the Service Gateway. | A high number of connected components may coincide with a high value for the pending requests if the volume of requests is high. |
| Pending Requests | Number of requests the Service Gateway has not yet processed. | A rise in this metric may indicate a performance issue as the Service Gateway has a backlog of requests to action. |
| HTTP Requests and Responses | Number of HTTP requests and responses. | If Requests ≠ Responses, system is not processing all the Requests. |
| IPC Requests and Responses | Number of IPC requests and responses. | If Requests ≠ Responses, system is not processing Requests correctly. |
Aggregator
The Aggregator combines data from multiple database tiers and tables.
The workbook gives you the option to select the Aggregator type, which retrieves information from the Production Environment or the Query Environment (identified as "qe").
| metric | description | recommendation to maintain a healthy system |
|---|---|---|
| Requests in Progress by Pod | Number of aggregation requests being processed by each aggregator. | It depends on the use-case. |
| Errors and Timeouts | Number of aggregation requests that have failed. | If > 0 this requires investigation. |
| Requests by type | Total number of requests by type. | It depends on the use-case. |
| Aggregation Duration | Speed at which each aggregator completes a request. | Speed depends on the amount of data to be aggregated. |
RT Monitoring
Information about the current network traffic going through RT-related Pods in the system.
| metric | description | recommendation to maintain a healthy system |
|---|---|---|
| ALL Nodes view: RT Pods with their Network Traffic | Average Network traffic going through RT-related pods in the deployment (bytes/second). | Should be > 0 if data ingestion is active in an assembly. |
| Specific Node view: RT Pods with their Network Traffic | Network traffic going through a specific Node that contain RT-related pods in the deployment, divided by Pod (bytes/second). | Should be ≠ 0 if data ingestion is active in an assembly. |