User interface
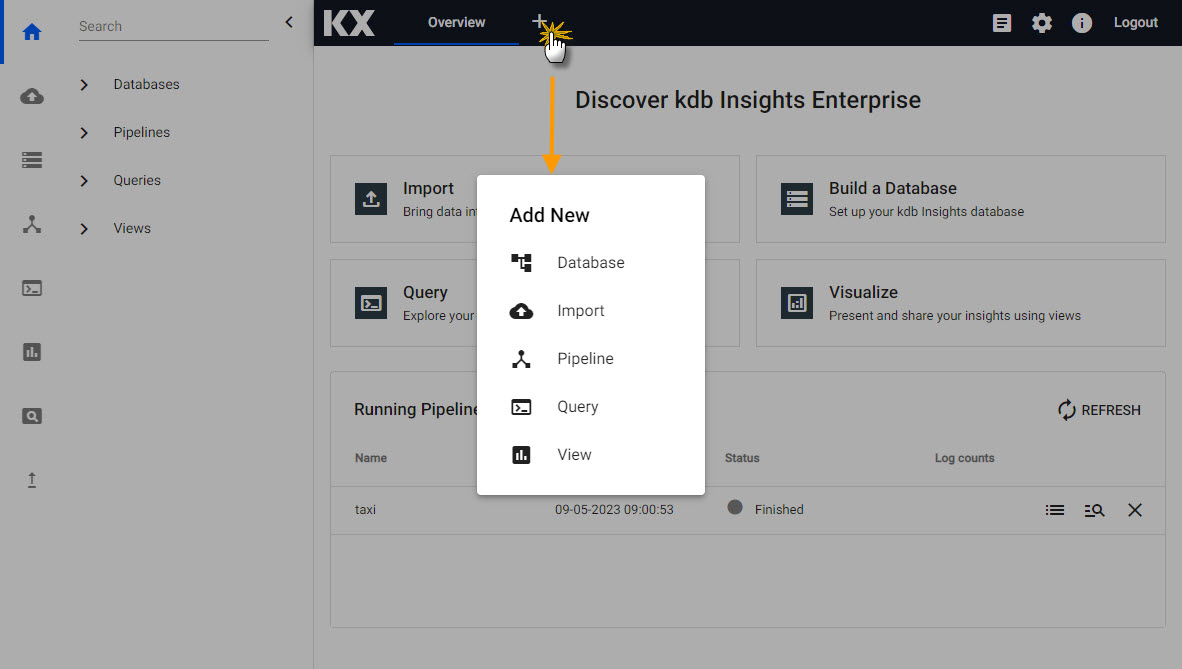
The Overview page is the home page for kdb Insights Enterprise. kdb Insights Enterprise UI runs on the latest version of Chrome, Safari, Edge and Firefox; we recommend Chrome.
Home page of kdb Insights Enterprise.
Menu items are navigable by Tab, Enter to select, and Esc to close.
Icon menu
On the far left is an icon menu for one-click access to kdb Insights Enterprise features.
| Icon | Description |
|---|---|
Home |
Return to the Overview page. |
Import |
Import data from an external source and write it to a kdb Insights Enterprise database. |
Database Builder |
Build a database. A database assembly includes a schema and stream for data. Recommended for new users. |
Pipeline templates |
Build a pipeline template. A pipeline is the process of reading data from an external source and writing it to a kdb Insights Enterprise database using a pipeline template. |
Queries |
Interact with data stored on the database. |
Views |
Visualize data with charts, tables, maps, user inputs and more. |
Diagnostics |
Check the status of pipeline and database deployments |
Upgrades |
Upgrade streams and schemas to ensure compatibility with the latest version of kdb Insights Enterprise. |
You can customize the icon menu. Right-click on an icon and select the check-boxes from the resulting menu.
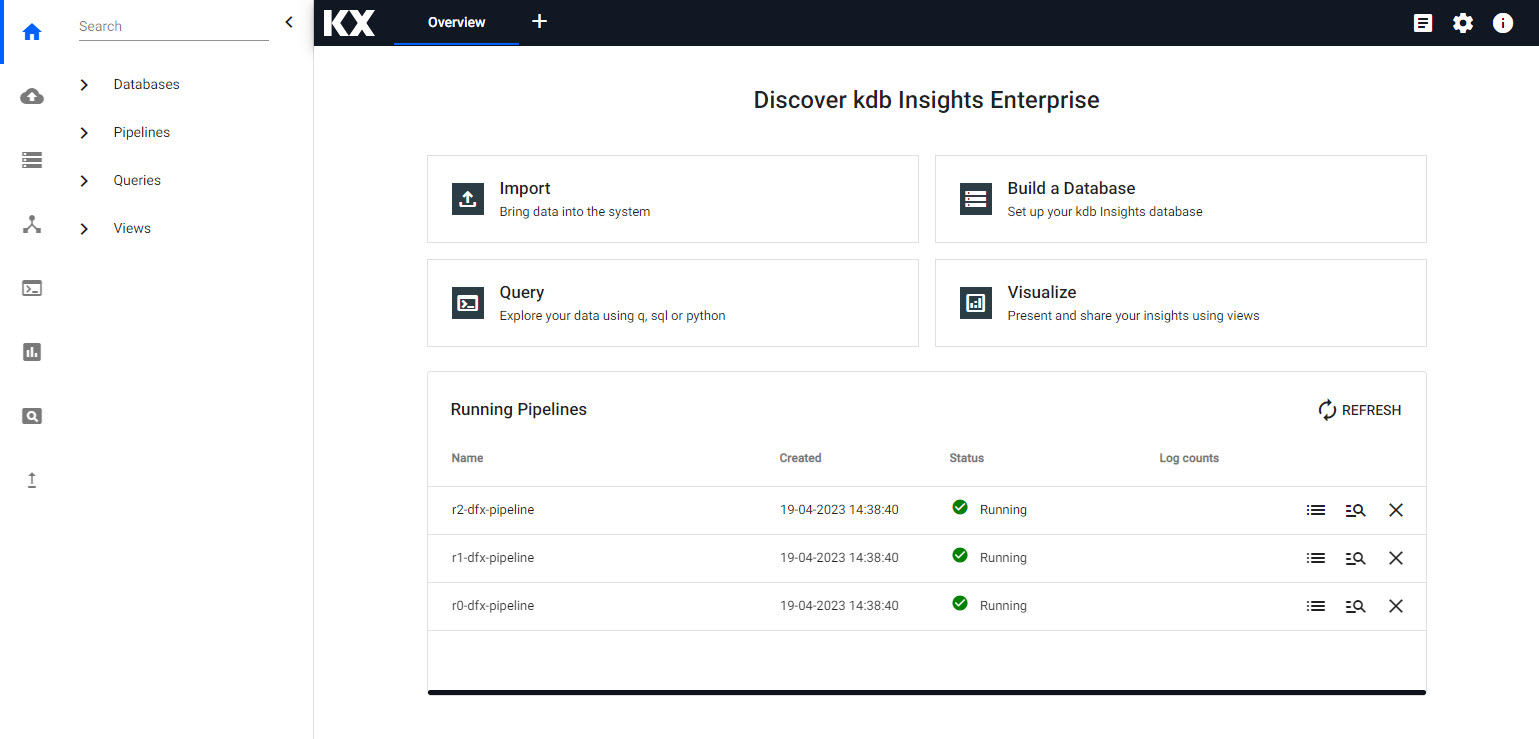
Left-hand entity-tree menu
The left-hand menu is dynamic entity tree. Menu options are contingent on the main workspace; for example, building a pipeline with the pipeline template the entity tree lists all pipeline nodes. If importing data with the import wizard, the left-hand menu displays a list of steps.
When on the Overview page, the entity-tree is a selection of databases, pipelines, queries and views.
Example entity-tree.
Ribbon Menu
The ribbon menu is a top level document bar of tabbed pages. Click [+] to open a menu of items for databases, database wizard, data import, pipelines, queries, and views.
Use the Tab control to navigate between selections, Esc to close the dialog.
 Document bar and tabbed menu options.
Ribbon Icon Menu
| item | description |
|---|---|
 |
A log of system errors. Click  for a full page view. for a full page view. |
 |
Click to download system diagnostics. Note: This is a resource heavy process to run. |
 |
Displays platform version and offers a link to documentation. |
Discover kdb Insights Enterprise
- Import data using a wizard to read data from source, transform, then write to a kdb Insights Enterprise database.
- Build a Database to store your data.
- Query data stored on a database.
- Visualize data using a dashboard.
Running Pipelines
Pipelines are the set of steps, called nodes, required to read data from source and write it to a kdb Insights Enterprise database.
The table lists the status of active, running nodes, and pipelines that errored during the activation process.