Diagnostics
Troubleshoot database, pipeline and system errors with Diagnostics. One tab covers deployment events, the second tab records deployment logs.
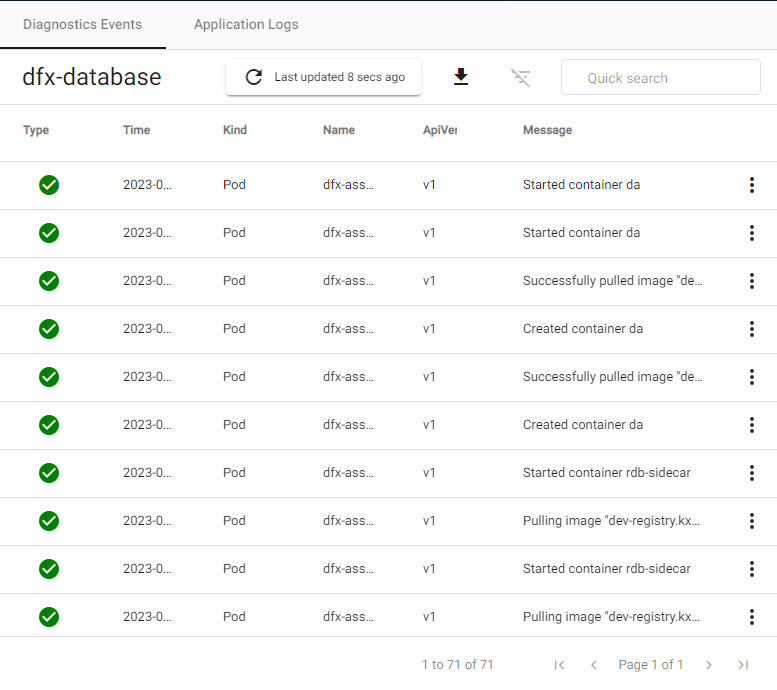
Event summary for a pipeline deployment.
The time since last update is displayed next to the refresh icon for both events and logs.
The time since the last update is displayed next to the refresh icon.
Access Diagnostics
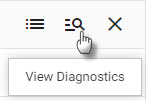
With the appropriate Keycloak role permisisons, click the  icon in the left-hand-side bar.
Select a Database or Pipeline
Select a database or pipeline from the left-hand-menu.
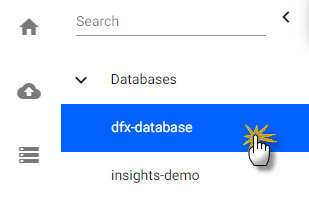
Diagnostics left-hand-menu of deployed database and pipelines.
Access database diagnostics from the database editor; click to select a database from the left-hand-menu of the Overview page.
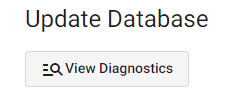
Access diagnostics from the database editor view.
Access pipeline diagnostics on rollover of the pipeline listed under Running Pipelines of the Overview page.
View diagnostics on icon rollover under Running Pipelines of the Overview page.
Diagnostic Events and Application Logs
Two sets of views are available:
Reported events generated by a database or pipeline deployment. Results are paged. Click on a header column to sort and filter.
Search for a particular phrase across all columns with text Quick search; export results as a .json file.
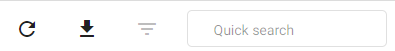
Diagnostics toolbar: refresh, download, filter or search for terms in the events and log files.
Diagnostic data is cached; click the refresh icon to update. Alternatively, close and re-open the current tab from the ribbon menu.
Logs generated by a database or pipeline deployment. Results are paged, and can be exported, refreshed, searched, and sorted.
Check filter to view logs by:
- Fatal errors
- Non-Fatal errors
- Warnings

Set the filter options for the logs; select from Fatal, Error or Warning
Download a '.json' report of events or logs by clicking the  icon.
icon.
System Errors
Click the System Notifications icon in the ribbon menu for real-time notifications of events in the current session.
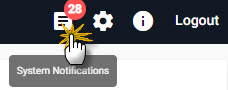
Click the system notifications icon in the ribbon menu to view real-time notifications of the current kdb Insights Enterprise session.
This opens a slider panel of system notifications. Filter results with a text search.
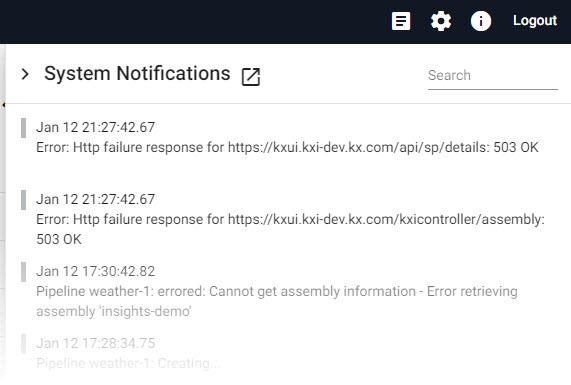
A live view of event messaging for the current session.
Click the new tab link for an expanded view of notifications.
Click the new tab icon for an expanded notifications view.
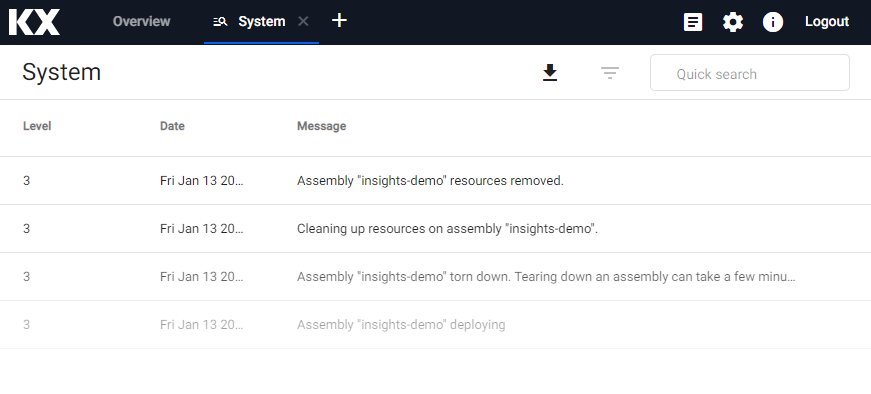
Expanded notifications view.
System Settings
Click  to set the system log level (
Trace, Debug, Info, Warn, Error, Fata), trace level (as appropriate), and an option to download a full diagnostic report of the system.
Downloading a full diagnostic report is a resource heavy process.
Beta UI switch
When enabled, Assembly is a Beta view.
Export Full System Diagnostics
Click the icon to download a .json file of system notifications. This is a resource-heavy process.
Keycloak permissions
Ensure you have the appropriate Keycloak permissions to download system diagnostics.
Keycloak permissions
Diagnostics for kdb Insights Enterprise requires the appropriate Keycloak permissions. Ensure you are insights.role.viewer as a minimum; this gives permission to view (but not change) all diagnostics. Note, a Keycloak admin is required to assign diagnostic roles to your user id. Available roles detailed below:
| item | description |
|---|---|
insights.monitor.pod.logs.get |
Gives access to logs on the "Application Logs" tab in the diagnostics view. These logs include kdb Insights Enterprise specific informational messages and are useful for debugging a running system. |
insights.monitor.events.get |
Gives access to the "Diagnostics Events" tab in the diagnostics view. These logs include Kubernetes specific events and are useful for debugging startup issues. |
insights.monitor.logLevels.getLevels |
Allows for access to view the log levels in the level selector drop down. |
insights.monitor.logLevels.set |
Allows you to change the log level across all kdb Insights Enterprise components from the "Application Log Level" drop down. |
insights.monitor.logLevels.get |
When opening the diagnostics view, this provides access to view the log level that is currently set by in the "Application Log Level" drop down. |
insights.monitor.diagnostics.get |
Allows you to download the diagnostics report from your system. |
Changing log levels as a diagnostic viewer
If you are an insights.role.viewer for diagnostics, you must also be an insights.role.reporter if you wish to change the log level.
For more on assigning roles in Keycloak for kdb Insights Enterprise