How to Configure Global Properties
This page describes the Global Properties available in KX Dashboards and how to configure them.
Global Properties define settings that apply across all dashboards, allowing you to enforce consistent behavior, formatting, and styling from a single location.
These properties are available to all users in Edit Mode, and changes persist across sessions. Most properties can be saved for everyone or for you alone.
Important
A property saved for all users affects all dashboards and every user, so configure it with care.
Accessing Global Properties
Global Properties are only available when Edit Mode is active.
To open the Global Properties panel:
- Click the Menu icon (☰) in the top toolbar.
- Select Global Properties.
- Choose the property you want to view or modify.
- Edit the value as required.
- Click Save to apply your changes.
Set the scope of a property
Most properties can be saved for everyone or for you alone. Two small buttons in the top right corner of the property set this, and the active one is highlighted in blue:
- Group icon — This property is saved for all users. Everyone who uses the deployment gets this value.
- Single user icon — This property is saved only for you. Only you get this value.
Scope is set per property, so a single Save can store some properties for all users and others only for you.
Save a property only for yourself when you want to change a setting for your own use — a different Timezone, for example — without changing it for everyone else.
Available properties
Global Properties includes five tabs: General, Query, NLX, Audit, and Maintenance.
General
The following properties are available under the General tab:
-
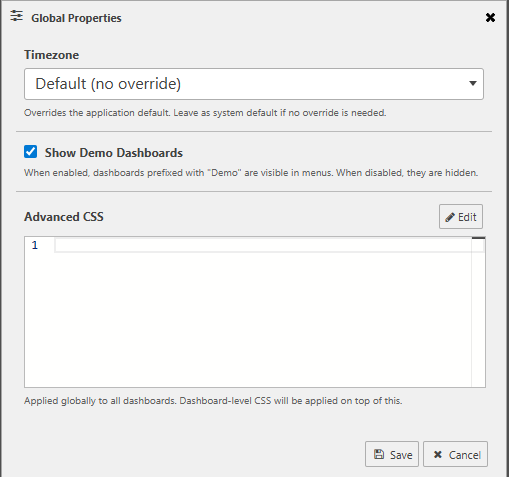
Timezone — Defines a global timezone for the application. When set, all date and time values across dashboards are displayed and processed using this timezone, rather than the user's local system time. This ensures consistent time-based analysis across users and regions. Leave it as Default (no override) to use the application default. See Timezone for more details.
-
Show Demo Dashboards — When enabled, dashboards prefixed with
Demoare visible in menus. When disabled, they are hidden. -
Show AI Flags — When enabled, dashboards that AI generated or modified show an indicator in the dashboard header. Disable it to suppress AI flags across the deployment. Dashboards record whether AI created or edited them either way, so disabling this setting hides the indicator without discarding the information.
-
Enable Chat Agent — When enabled, users can open the chat agent. When disabled, the chat agent and its popups are hidden, and users are told to contact their administrator. An administrator can re-enable it here at any time.
-
Export Filename Source — Determines which dashboard field names the file when you export a dashboard. Display Name can contain spaces; Name and ID use the space-free internal identifier.
-
Advanced CSS — Allows you to define custom CSS rules that are applied across all dashboards from a centralized location. This allows for consistent styling and branding without needing to configure individual components. CSS set on an individual dashboard is applied on top of these rules. See Advanced CSS for more details.
Query
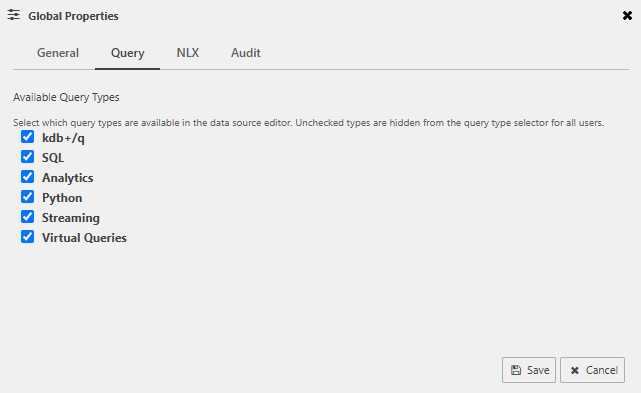
The Available Query Types property on the Query tab controls which query types are available in the data source editor. Select the types you want to make available:
- kdb+/q
- SQL
- Analytics
- Python
- Streaming
- Virtual Queries
Types you clear are hidden from the query type selector for all users.
NLX
The NLX tab lets you configure the Dashboards chat agent. See NLX settings for more details.
Audit
The Audit tab controls whether chat agent activity is recorded to a kdb+ table. See Audit chat agent activity for more details.
Maintenance
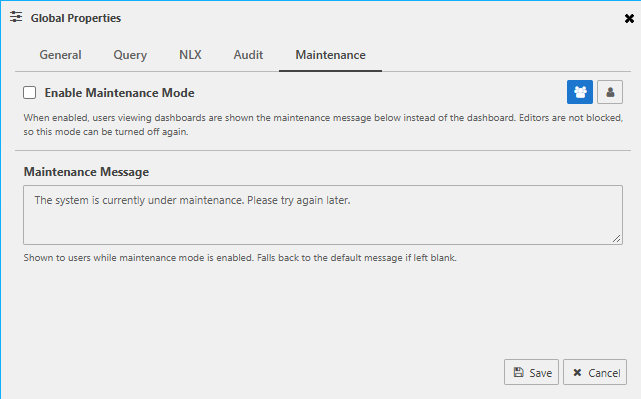
The Maintenance tab controls whether users can view dashboards. Use it to take dashboards out of service while you work on the deployment.
The following properties are available under the Maintenance tab:
-
Enable Maintenance Mode — When enabled, users viewing dashboards see the Maintenance Message instead of the dashboard. Editors aren't blocked, so you can still turn maintenance mode off again.
-
Maintenance Message — The message shown to users while maintenance mode is enabled. If you leave it blank, the default message is used: The system is currently under maintenance. Please try again later.
Next Steps
Learn more about managing themes: