Configure and Use the Chat Agent
This page describes how to configure and use the Dashboard Builder (chat agent) to create and edit dashboards using natural language.
The Dashboard Builder (also referred to as the chat agent) lets you generate and modify dashboards by describing what you want in plain language. Before it can be used, an administrator must configure an AI provider via Global Properties.
For a conceptual overview, see Natural Language Chat Agent.
Prerequisites
You must have administrator access to configure the chat agent. End users can use the chat agent once it has been configured.
The chat agent must also be enabled. Enable Chat Agent is on the General tab of Global Properties and is what makes the chat agent available to users; the settings on this page have no effect while it is disabled.
Windows
Run dash.bat as normal. It automatically installs Express v4 if not already present and starts the NLX proxy — no additional steps required.
Linux and macOS
No shell launcher is provided, so you set up and start the NLX proxy manually from the Dashboards Direct root directory.
Install Express v4 (one-time):
npm install --save express@4
Start the NLX proxy before launching KX Dashboards, and leave it running in its own terminal:
node nlx-proxy.js
Warning
Do not install Express v5. The NLX proxy script is not compatible with it and fails with a PathError. Use Express v4 (for example, 4.22.2).
No additional setup is required. Proceed to Configure the chat agent.
Configure the chat agent
Configuration is done via Global Properties, which is accessible from the main menu in Edit Mode.
- Click the hamburger menu icon (☰) in the top-left corner of the application.
- Select Global Properties.
- Select the NLX tab.
- Configure the settings described in the table below.
- Click Save to apply your changes.
The following video shows how to configure the NLX Global Properties.
Warning
NLX settings saved for all users apply to everyone in the deployment. Ensure the AI provider and API key you configure are appropriate for your organization's data and security requirements.
NLX settings
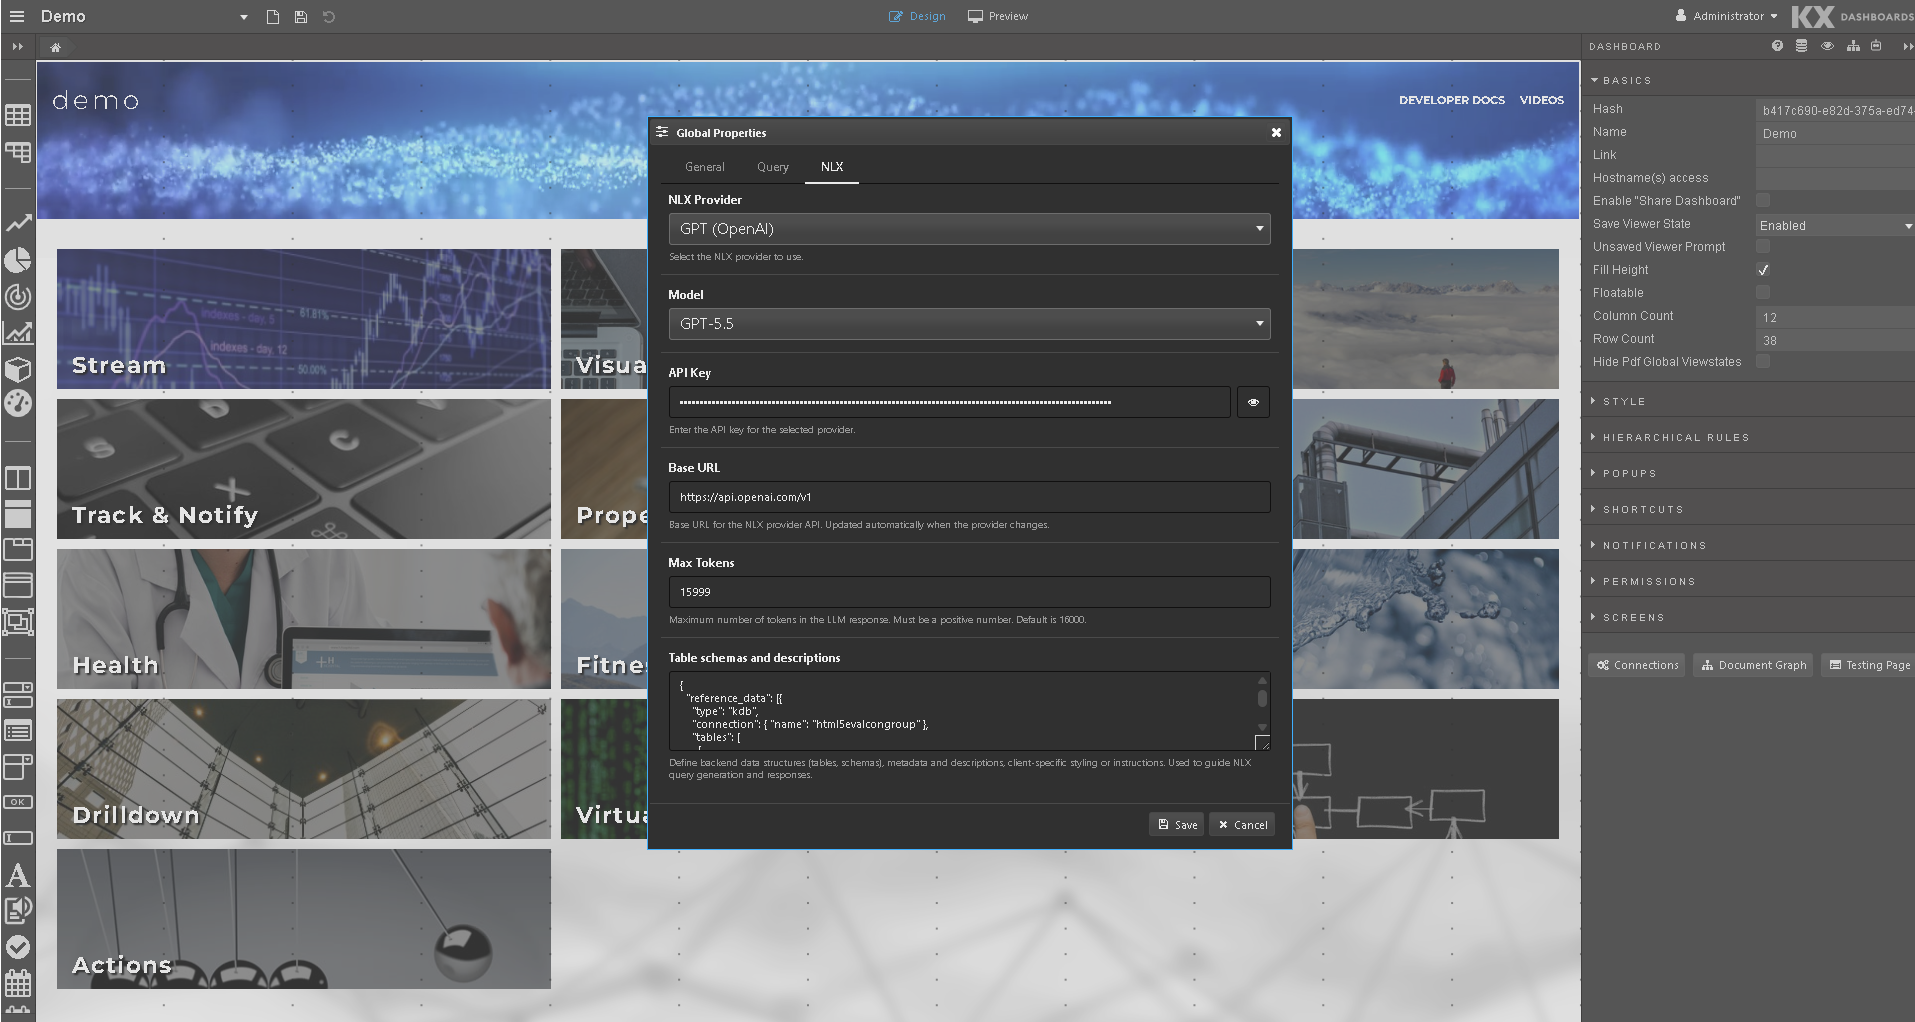
| Setting | Description |
|---|---|
| NLX Provider | The AI provider to use. Supported options are OpenAI, Claude (Anthropic), and Gemini. |
| Model | The specific model to use for the selected provider. |
| API Key | Your API key for the selected provider. This is stored and used to authenticate requests. |
| Base URL | The base URL for the provider's API. Updated automatically when the provider changes. Override this only if you are using a custom or self-hosted endpoint. |
| Max Tokens | Maximum number of tokens in the model's response. Must be a positive number. Default is 16000. |
| Table schemas and descriptions | A JSON definition of the backend data structures the agent will use — tables, schemas, metadata, column descriptions, and any client-specific styling or instructions. This guides the agent when generating queries and responses. See the example below. |
Table schemas and descriptions example:
{
  "type": "kdb",
  "connection": { "name": "connectionName" },
  "tables": [
    {
      "name": "TableName",
      "description": "Brief description of the table and its intended use. Note any type quirks or recommended components. Subscription: static | polling | streaming.",
      "columns": [
        { "name": "id",          "type": "long",    "description": "Unique record identifier." },
        { "name": "name",        "type": "string",  "description": "Display name or label." },
        { "name": "value",       "type": "float",   "description": "Numeric measure." },
        { "name": "category",    "type": "symbol",  "description": "Grouping or filter dimension." },
        { "name": "date",        "type": "date",    "description": "Date field. Note any casting requirements." },
        { "name": "latitude",    "type": "float",   "description": "Latitude (decimal degrees). Use for map Latitude binding." },
        { "name": "longitude",   "type": "float",   "description": "Longitude (decimal degrees). Use for map Longitude binding." }
      ]
    }
  ]
}
Write useful descriptions
The agent relies on these descriptions to build correct queries, so it's worth writing them carefully. Useful things to include:
- What the table is for, and which components suit it. For example, "Daily OHLC + volume for the S&P 500 Index. Use for candlestick, line, and volume bar charts."
- The subscription type —
static,polling, orstreaming— so the agent configures the data source correctly. - Type quirks and the cast needed. If a date is stored as a string, or a numeric value is stored as a character, say so and give the cast. For example, "NOT a native kdb+ date — cast with
`date$datefor arithmetic", or "Date is DateTime not Date. Use Date.date in where clauses." - Column names that need quoting. If a column name contains a space, note that it must be quoted in kdb+.
- Component binding hints. For example, "Map binding: latitude_deg → Latitude, longitude_deg → Longitude", or a suggested minimum and maximum for a Gauge.
Audit chat agent activity
You can record chat agent activity to a kdb+ table, which gives you a structured source for monitoring and auditing how the chat agent is used.
- Click the hamburger menu icon (☰) in the top-left corner of the application.
- Select Global Properties.
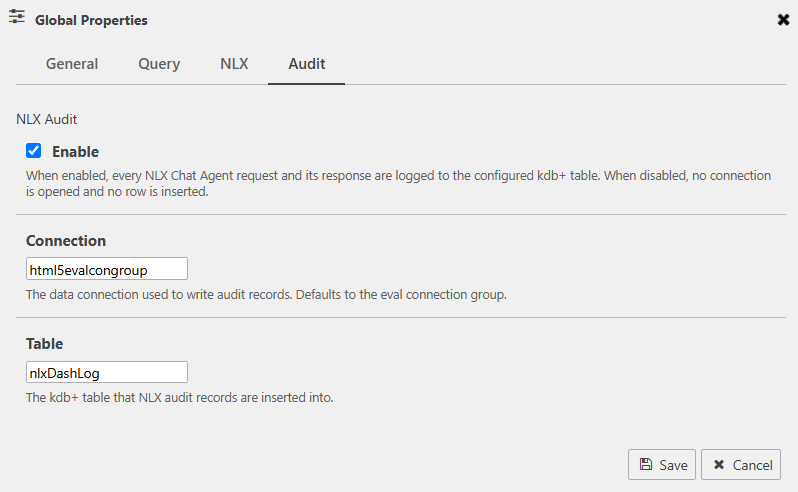
- Select the Audit tab.
- Configure the settings described in the following table.
- Click Save to apply your changes.
| Setting | Description |
|---|---|
| Enable | When enabled, every chat agent request and its response are logged to the table you specify. When disabled, no connection is opened and no row is inserted. |
| Connection | The data connection used to write audit records. Defaults to the eval connection group. |
| Table | The kdb+ table that audit records are inserted into. Dashboards creates a default table, nlxDashLog. To use a different table, enter its name here. |
Audit record contents
Each request adds a row with the following columns:
| Column | Description |
|---|---|
timestamp |
When the request was made. |
request |
The prompt sent to the provider. |
provider |
The AI provider used for the request. |
model |
The provider's model identifier. |
mode |
Whether the request was a generate, an edit, or an info question. |
success |
Whether the request succeeded. |
response |
The response returned by the provider. For generate and edit requests this is the dashboard definition JSON; for info requests it's the text answer. |
Warning
The request and response columns contain the prompts users typed and the content the provider returned. Restrict access to the table in line with your organization's data handling requirements.
Tip
The audit table is an ordinary kdb+ table, so you can query it or build a dashboard over it like any other data source — for example, a Data Grid of recent requests with the Excel and CSV export options enabled.
Access the chat agent
Once configured, the chat agent is available to all users from the main menu.
- Click the hamburger menu icon (☰) in the top-left corner of the application.
- Select Chat with AI Builder.
The Dashboard Builder dialog opens.
The following video shows a run-through of how to use the chat box to generate and edit dashboards.
Choose the tables and analytics to use
Expand the Tables panel at the bottom of the dialog to see the data available to you, and select what you want the agent to work with. This saves the agent from having to infer which data you mean.
- Use Search tables to filter a long list.
- Select the check box beside each table or analytic you want to use. Your selections appear as tags above the list, and the panel header shows how many you have selected.
- Analytics are marked with an ANALYTIC tag.
- Click the X on a tag to remove one selection or uncheck the box. Use Clear all to remove them all.
Note
The tables and analytics listed here come from the Table schemas and descriptions setting. If something you expect is missing, ask an administrator to add it. See NLX settings.
Create a dashboard
-
Open the Dashboard Builder dialog and type a natural language description of the dashboard you want to create.
For example: "Create a dashboard showing trade data with a line chart and link FX symbols with a dropdown."
Be as specific as you can about component types, groupings, and how components should interact. See Tips for good prompts for examples.
-
Optionally, specify a table name, or select one in the Tables panel, if you want the agent to generate the dashboard against a specific data source.
If you don't specify one, the agent infers the most relevant table from your description. For best results, name it explicitly when you know it — for example, "using the TradeData table."
-
Select Generate (selected by default).
This tells the agent that you want to create a new dashboard, as opposed to editing the currently open one.
-
Click Send, or press Enter, to submit the prompt.
The agent creates a new dashboard configuration based on your description, and KX Dashboards loads it automatically.
Edit an existing dashboard
You can use the chat agent to modify a dashboard that is already open. The chat agent always acts on the currently open dashboard.
-
Open the dashboard you want to edit.
Navigate to it from the dashboard list or open it directly using its URL.
-
Open the Dashboard Builder Chat dialog from the main menu.
This is accessible from the top-level menu bar, not a right-click (context) menu. If the dashboard is in view-only mode, the option doesn't appear — switch to edit mode first.
-
Select Edit mode.
Generate mode is selected by default. To edit your existing dashboard, select the Edit option.
-
Describe the changes you want to make.
Type your request in natural language in the input field. The more specific you are, the better the result. For example: "Add a dropdown to filter by currency and link it to the existing chart."
-
Click the Send icon, or press Enter.
The request is sent to the AI provider, which automatically updates the dashboard. The chat history shows a Summary of changes and an Edited Dashboard entry with a link to the dashboard.
Scope edits to reduce token usage
By default, the chat agent includes the full dashboard configuration as context, which can use a lot of tokens on larger dashboards. To reduce this, click the specific component you want to change before entering your prompt. The agent then scopes its context to that component only.
For example, instead of prompting "change the SharePrice chart to a bar chart" against the whole dashboard, select the chart first, then prompt "change this to a bar chart."
See High token usage or slow responses for more ways to reduce token usage.
Ask for analytics
As well as describing a dashboard to build, you can ask the chat agent to analyze your data in natural language. The agent runs the analytics against the table it is working with and builds the results into a dashboard, so you don't have to write the queries yourself.
- Open the Dashboard Builder dialog.
- Select Generate.
-
Describe the analysis you want. Name the table, the measure you want calculated, and how you want it grouped.
For example: "Show cumulative return over time from TradeData as a line chart, split by Group."
-
Click the Send icon, or press Enter.
The agent creates the data sources it needs from the source table and adds components bound to them. The chat history then shows a Summary of changes listing what it added — for the prompt above, a data source called CumuReturnData and a ChartGL widget bound to it — followed by a Generated Dashboard entry with a link to open the result.
The more precisely you describe the measure and the grouping, the more focused the result. A vague request leaves the agent to choose the measures, the groupings, and the components for you, which usually produces more than you wanted.
Tip
If more than one table is available, name the one you want analyzed, in the same way as when generating a dashboard. See Tips for good prompts.
Ask questions about a dashboard or the platform
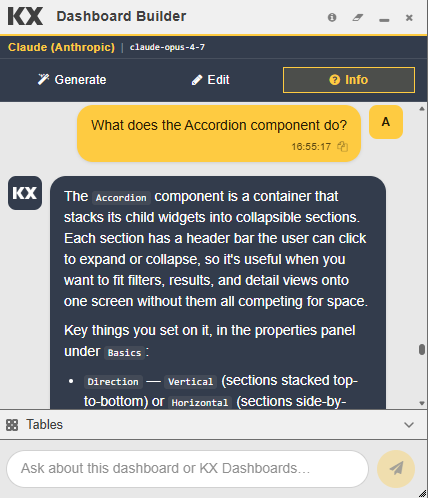
Select Info to ask questions instead of building. The agent answers in the chat, so you can get information without leaving the dashboard workspace.
- Open the Dashboard Builder dialog.
- Select Info. The prompt box changes to Ask about this dashboard or KX Dashboards.
- Type your question and click the Send icon, or press Enter.
The agent replies in the chat.
Use Info to ask about:
- The dashboard you have open — for example, which data source it uses.
- The data available to you — for example, "Which tables are available to me?" The agent lists the tables the deployment exposes, with a short description of each. Column schemas aren't included in that list.
- The product — for example, "What does the Accordion component do?" The agent describes the component and the properties you set on it.
What Info doesn't do
Info doesn't run queries, so it can't return calculated values from your data. Asking for an average returns an explanation of how to get it, not the number.
Info also doesn't create or change widgets. If you give it a build request, it tells you so and suggests a prompt to use instead. Switch to Generate to build a new dashboard, or Edit to change the open one.
Component skills
The agent works from a skill for each supported component: a structured definition that tells the agent what the component can do and which properties to set on it.
Skills are named after the component they describe — for example, kx-chartgl or kx-datagrid. The agent loads only the skills a request needs rather than all of them at once, which keeps token usage down. To see which skills a response used, expand Generation details and check Loaded skills.
Because skills are selected from what you type, name the component type in your prompt. Asking for a ChartGL loads the ChartGL skill, whereas asking for "a chart" leaves the agent to infer which component you meant. See Tips for good prompts.
Skill coverage varies by component and is extended over time. If the agent configures a component only partly, check the release notes for changes to that component's skill.
Generation details
Alongside each response, the chat history shows what context the agent used and what it changed:
- Loaded skills — The component skills the agent selected for the request. The list varies with what you ask for: naming a component type loads that component's skill, for example
kx-chartglorkx-datagrid. - Loaded table info — The table the agent used, and its columns.
- Summary of changes — A list of the changes the agent made to the dashboard. For an edit, this also states what the agent left unchanged, so you can check that the rest of the dashboard was untouched.
The provider and model in use are shown at the top of the Dashboard Builder dialog.
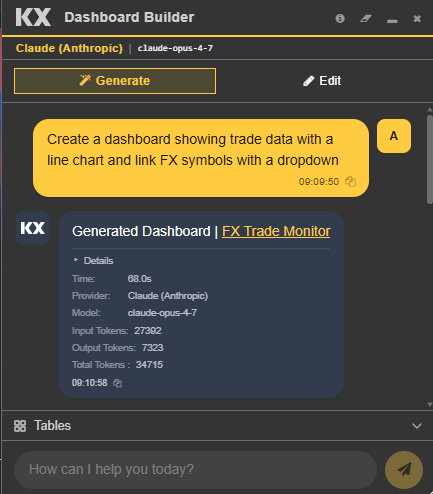
Each response in the chat history also includes details that show metadata about the generation. Click Details to expand it.
REQUEST
| Field | Description |
|---|---|
| Time | How long the generation took, in seconds. |
| Provider | The AI provider used for the request. |
| Model | The specific model used. |
TOKENS
| Field | Description |
|---|---|
| Input | The number of tokens sent to the provider, including your prompt and the dashboard context. |
| Output | The number of tokens returned by the provider. |
| Total | Combined input and output token count. |
Note
Token counts reflect the full context sent to the provider, which includes your prompt, data source metadata, and the dashboard generation instructions. High input token counts are expected.
Identify dashboards created or edited by AI
Dashboards record whether AI created or edited them. When the Show AI Flags Global Property is enabled, a label appears in the dashboard header, so you can tell AI-generated content from manually created content:
- AI Generated — The chat agent created the dashboard.
- AI Modified — The chat agent edited an existing dashboard.
Disabling Show AI Flags hides the label across the deployment. Dashboards still record how they were created either way, so turning the flags off doesn't discard the information.
Chat history
Each session is saved automatically. From the Dashboard Builder dialog you can:
-
Reopen a previous dashboard — Click the link in your chat history to load a previously generated dashboard.
-
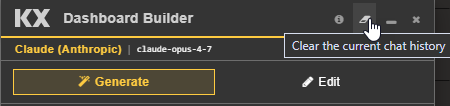
Delete your history — Use the delete option in the dialog to permanently remove your chat history.
Note
Deleting your chat history is permanent and cannot be undone.
Tips for good prompts
The chat agent works best when your prompt gives it clear, specific instructions. The more precise you are about what, where, and how, the fewer follow-up corrections you need.
General principles
- Be specific about the component type. Say datagrid, line chart, dropdown filter, or map rather than table or widget. This maps directly to the components the agent can create.
- Name your data source. Include the table name or analytic if you know it — for example, "using the SharePrice table" — so the agent doesn't have to guess or ask. Alternatively, pick the table names or analytics from the list provided in the chat agent dialog.
- Make one clear change per prompt. Chaining several unrelated changes in one prompt increases the chance of a partial or incorrect result. Prefer a short sequence of prompts over one long one.
- Reference components by name when there's more than one. "The existing chart" is ambiguous if there are three charts on the dashboard — say "the SharePrice line chart" or select the component first. See Scope edits to reduce token usage.
- State layout intent when it matters. For example: "Place it above the grid," "make it span the full width," or "put it in the top-right panel."
Prompts for generating new dashboards
| Instead of | Try |
|---|---|
| "Make me a dashboard" | "Create a dashboard showing SharePrice as a line chart, with a Town datagrid below it filtered by county" |
| "Add some filters" | "Add a dropdown to filter by currency, and a date range picker above the chart" |
| "Show sales data" | "Add a bar chart of TradeData grouped by region, with a legend" |
Include, where relevant:
- The data table to use.
- The component type — chart, grid, map, filter, and so on.
- Any grouping, filtering, or aggregation logic.
- Linking behavior — should the new component filter or interact with existing ones?
Prompts for analytics
Name the table, the measure to calculate, and how to group it. The following prompts each produce a single component bound to a data source the agent creates for the purpose.
| Prompt | Result |
|---|---|
| "Show cumulative return over time from TradeData as a line chart, split by Group" | A ChartGL widget bound to a new aggregate data source |
| "Rank traders in TradeData by total Return in a datagrid, showing Trader, Group, and PerReturn" | A Data Grid of ranked totals, with the columns you named |
| "Compare average PerEfficiency by Plant from PlantStatus as a bar chart" | A ChartGL bar chart of one averaged measure per category |
| "Chart average Footfall by Location over DateTime as a line chart" | A ChartGL line chart of an averaged measure over time, split by category |
Tip
If a column's type needs converting before it can be used — for example a date stored as a string — say so in the prompt, or record it in the Table schemas and descriptions setting so the agent applies it every time. See Write useful descriptions.
Prompts for editing existing dashboards
| Instead of | Try |
|---|---|
| "Fix the chart" | "Change the SharePrice chart to a bar chart and add a legend" |
| "Add a filter" | "Add a dropdown to filter by currency and link it to the existing chart" |
| "Make it bigger" | "Increase the height of the datagrid to fill the remaining panel space" |
- Select the component first if you're editing something specific. This scopes the agent's context and reduces token usage. See Scope edits to reduce token usage.
- Describe the linking explicitly when you want components to interact. "Link it to the existing chart" tells the agent to wire up filtering and selection behavior, not just place the component visually.
- Call out what should stay the same, if it matters. For example: "keep the existing color scheme" or "don't change the layout of the other panels."
If the result isn't what you expected
- Rephrase with more specific component names or table names rather than repeating the same prompt.
- Break a multi-part request into separate prompts.
Troubleshooting
The chat agent isn't available
- Check that the chat agent is enabled. When Enable Chat Agent is disabled in Global Properties, the chat agent and its popups are hidden and users are told to contact their administrator. An administrator can re-enable it on the General tab at any time.
- Confirm an AI provider is configured. See Configure the chat agent.
The agent doesn't respond, or nothing happens on Send
- Check the AI provider connection. The chat agent requires a configured and reachable AI provider (Claude, ChatGPT, or Gemini). If the provider is down, misconfigured, or the API key or authentication has expired, the request fails silently or times out.
- Check your network or proxy. If dashboards are accessed through a reverse proxy — for example, behind OIDC or oauth2-proxy — confirm your session hasn't expired. An expired session can block the API call without a clear error in the chat window.
- Refresh and retry. If the dialog appears stuck, close and reopen the Dashboard Builder dialog rather than resending the same prompt.
The agent modified the wrong dashboard
- The agent always acts on the dashboard that was open when you launched the chat agent, not one selected from within the dialog. Confirm you opened the Builder dialog from the correct dashboard before prompting.
- If you have multiple dashboard tabs or windows open, double-check which one is active.
The agent added the wrong component, or misunderstood the request
- The prompt was likely ambiguous. Reference component types, table names, and existing widgets explicitly rather than using generic terms like "the chart" or "a filter." See Tips for good prompts.
- If there are multiple similar components on the dashboard, select the specific one before prompting so the agent knows which one you mean.
- Try rephrasing in a single, more specific prompt rather than repeating the same wording.
The edit only partially applied
- Multi-part prompts — for example, "add a filter, resize the grid, and change the chart color" — are more likely to apply only some of the requested changes. Split these into separate prompts and send them one at a time.
- Check the staged or preview response, if your build shows one, before it commits. Some changes may need explicit confirmation.
The Edit option is missing or grayed out
- The dashboard is likely in view-only mode. Switch to edit mode, or confirm you have edit permissions on that dashboard.
- Confirm the Dashboard Builder dialog was opened from the main menu, not a context menu. The Edit action may not be available from all entry points.
High token usage or slow responses
By default, the agent includes the full dashboard configuration as context. For large dashboards, this increases latency and cost.
- Select the specific component you want to change before prompting to scope the context. See Scope edits to reduce token usage.
- Avoid unnecessarily broad prompts like "review the whole dashboard and improve it" — target specific components and changes instead.