Vega Chart#
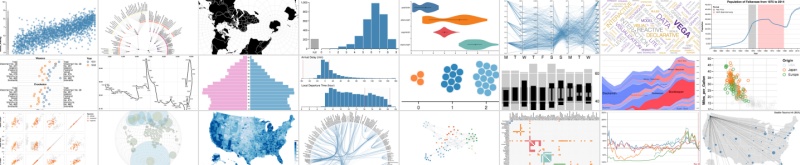
Component that renders a chart using Vega Chart library. Demonstration of capabilities of the library can be found in Vega Example Gallery.
Set up#
-
Set the data source.
-
Specify the JSON for the Vega Config.
Basics#
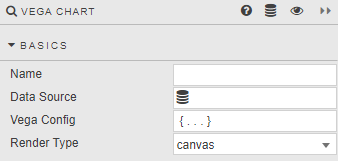
- Name
- A name for the component provided by the user.
Data Source#
A query or analytic. When set, values of first data item in Vega Config will be overwritten.
Vega Config#
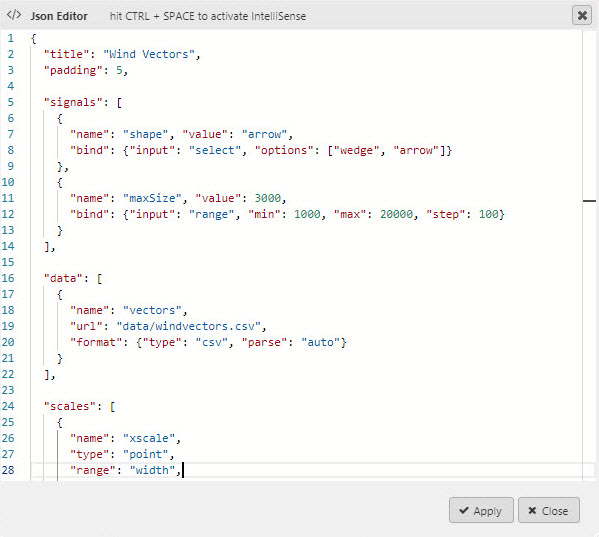
Specification in JSON format of multiple aspects of the chart:
- data handling and transformations
- visual representation
- behavior
Documentation about available options can be found on Vega Website.
Auto stretch
Chart will automatically fit available space if neither width nor height is specified.
Data Source override#
External resource in Vega configuration can referenced as shown in code below.
{
    "data": [{
        "name": "vectors",
        "url": "data/windvectors.csv",
        "format": {"type": "csv", "parse": "auto"}
    }],
    ..
Setting Data Source will modify the configuration above with actual values:
{
    "data": [{
        "name": "vectors",
        "values": [
            {
                longitude:7.5,
                latitude:4.3,
                ..
                speed:3.12
            },
            ..
        ]
    }],
    ..
Notice that the url and format properties are replaced with values.
Render Type#
Controls whether the chart is rendered as <canvas>(faster) or <svg>.
Style#
- Advanced CSS
- Advanced CSS
Format, Margins#
Style for common settings