Sankey#
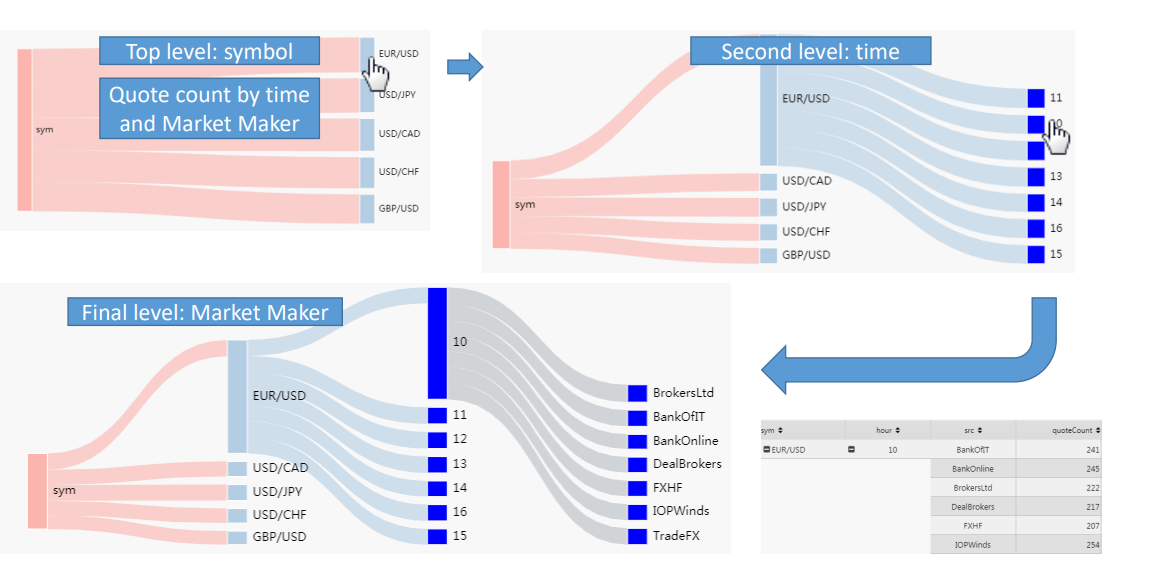
A Sankey chart is a flow diagram where the width of the flow is proportional to the rate
Basics#
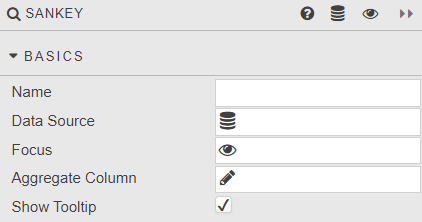
- Name
- A name for the component provided by the user.
- Data Source
- Has to be a pivot query Data sources
- Focus
- A view state parameter for linking components
- Aggregate Column
- The dependent data source variable used to create the flow map.
- Show Tooltip
- Toggle display of tooltip.