Publish and Export#
This page describes how to publish dashboards, how to install and configure the pdf server, and how to configure file export properties for use on published dashboards.
Once a dashboard is saved and published, anyone with the appropriate permission can view or edit it.
Snapshot PDF view
A screenshot of a dashboard can be taken using the PDF button:  . See PDF server for more details.
Publish Dashboards#
New dashboards are published by checking the box to the right of the Name; to convert a dashboard into draft form, uncheck this selection.
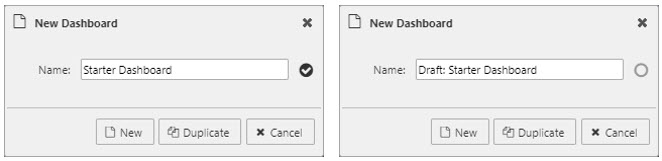
Draft dashboards are prefixed 'Draft' in the Document List. Draft dashboards are not visible in the Viewer.
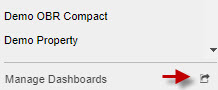
Draft dashboards show in the Manage dialog with no selection check; click the check to publish the dashboard. The Manage dialog is accessible at the end of the Document List.
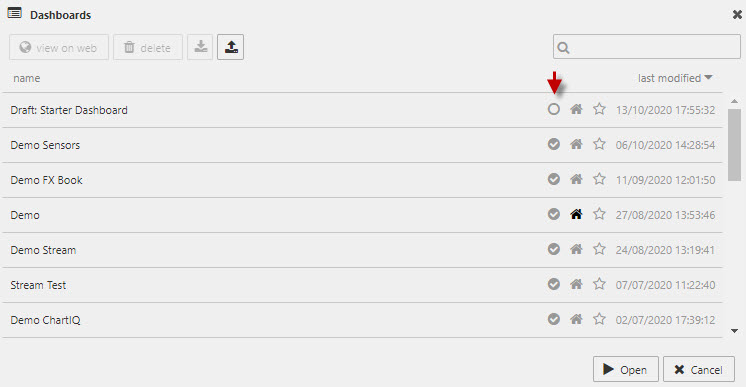
To view a dashboard, select a dashboard and click  . This opens the dashboard Viewer in a new tab.
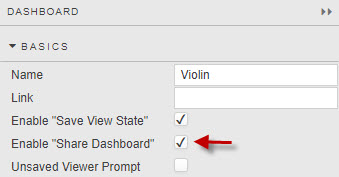
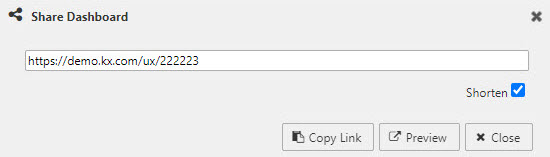
Social Share Link#
Enable "Share Dashboard" in the Dashboard menu
Share dashboard state#
Dashboards can be shared to include active states, allowing users to reproduce a view using specific user selections and inputs. This information is stored as part of the shared link.

Shorten link#
The share dashboard option also includes a link shortener.
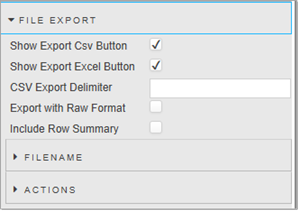
File export#
The following charts and grids have File Export properties which can be used to export data from these components as a CSV, XLS file, or screenshot option:
The options available vary depending on the component type. The full set of properties are described in the table below.
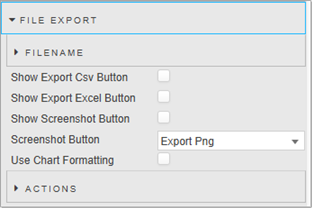
The following screenshots show an example of the File Export properties for a Data Grid, followed by the properties for a ChartGL component.
| Property | Description |
|---|---|
| Filename | You can set a variable to be used as either a filename for the exported file, or a View State Parameter which can be linked to a Text Input for user defined file names. 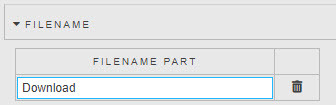 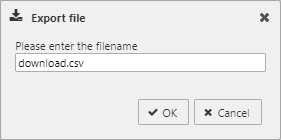 |
| Show Export CSV Button | When enabled, clicking the CSV button exports the displayed values as a CSV file. This can be set for all components that support File Export. |
| Show Export Excel Button | When enabled, clicking the Excel button exports the displayed values as an XLS file. This can be set for all components that support File Export. |
| CSV Export Delimiter | Specify the delimiter to be used in a CSV export. If none is specified a comma is used by default. This is only valid for Data Grids. |
| Full Export Override | This is only valid for Pivot Grids. Overrides the pivot query dataset with an alternative dataset. |
| Export with raw format | When this is enabled the raw format of the data is exported. This is only valid for Data Grids and Pivot Grids. |
| Show Screenshot Button | When enabled, clicking the PNG button takes the action set in the Screenshot Button parameter. This setting is not applicable to Pivot Grid or Data Grid components. |
| Screenshot Button | These options are only valid when Show Screenshot Button is enabled. These set the action taken when users click the PNG button. This can be to either export an image of the chart as a PNG, copy it to the clipboard, or do both. The options are: Export PNG Copy to Clipboard Export PNG & Copy to Clipboard When the image is copied to the clipboard a notification is displayed, unless notifications are being blocked in the user's browser. Copying to clipboard is not supported in Internet Explorer. |
| Use Chart Formatting | When checked, the formatting used by the chart axes is applied to the exported data. This only applies to the ChartGL component. |
| Include Row Summary | Check this to include any footers that are defined in the Data Grid. The footer detail is set in the Column properties and could, for example, be used to add a total to a column of numbers. That total is then exported with the data in the grid. This only applies to the Data Grid component. |
- Actions
-
Outputs details of the file export.
| Property | Details |
|---|---|
| fileType | The type of file exported e.g xlsx, csv, png |
| fileName | The exported name of the file |
| dashboardName | Name of the dashboard |
| dashboardId | The id used in the dashboard |
| timestamp | The time of the export |
| isSuccess | Where the export was successful or failed |
| username | Username used by the person who exported data |
| component | The component data being exported |
| meta* | The meta used by the datasource of the exported data |
| fileRowLength* | The row length of the datasource used by the exported data |
- not applicable to all components
PDF server#
Configuration & Installation#
Ensure all prerequisites are installed#
- Node.js v16.20.0+ (use LTS)
Install Puppeteer#
- Run
npm installin the/pdffolder. - If installation fails, see the troubleshooting section in
/pdf/README.md.
Start the PDF Server#
Start the PDF server by running q pdf.q in the /pdf folder
Enable PDF Button#
Update the /www/config.json file, add "PdfUrl": "http://localhost:5011/":
{
    "NewPdf": true,
    "pushStateBase": "",
    "PdfUrl": "http://localhost:5011/"
}
The enabled PDF Server adds the PDF icon in the Toolbar menu of Dashboards

Aditional Information#
Dashboard Printable Area#
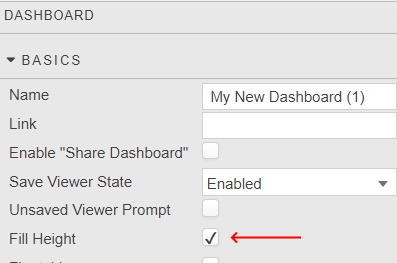
The PDF prints the viewable area. If the Dashboard scrolls off-screen, click Fill Height in Dashboard Properties to make the dashboard view a single page.
Expand Tab Component Contenet While Publishing#
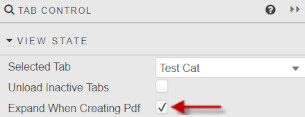
To enable Tab Control component to expand while ceating pdf make sure to click Expand When Creating Pdf in Tab Control Properties.
PDF Menu#
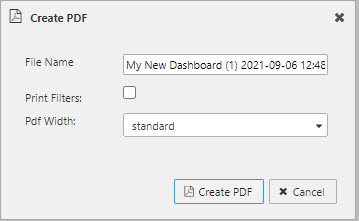
- File Name
- Exported PDF file
- Print Filters
- When enabled, the PDF includes details of shared view states from the URL.
- PDF Width
- Select between
standardor snapshotcurrent preview (1920px)