Pipelines
The kdb Insights Stream Processor is a stream processing service for transforming, validating, processing, enriching and analyzing real-time data in context. It is used for building data-driven analytics and closed loop control applications optimized for machine generated data from data sources, and delivering data and insights to downstream applications and persistent storage.
The Stream Processor allows stateful custom code to be executed over stream or batch data sources in a resilient manner, scaling up when data sources allow. This code can be used to perform a wide range of ingest, transform, process, enrich, and general analytics operations.
Stream processing
Stream processing is the practice of taking one or more actions on a series of data that originate from one or more systems that are continuously generating data. Actions can include a combination of ingestion (e.g. inserting the data into a downstream database), transformation (e.g. changing a string into a date), aggregations (e.g. sum, mean, standard deviation), analytics (e.g. predicting a future event based on data patterns), and enrichment (e.g. combining data with other data, whether historical or streaming, to create context or meaning).
These actions may be performed serially, in parallel, or both, depending on the use case and data source capabilities. This workflow of ingesting, processing, and outputting data is called a stream processing pipeline.
This document describes how to use the stream processor in kdb Insights Enterprise using the drag-and-drop, low code user interface.
Operators
Pipelines can be built by dragging operators from the left-hand entity tree and linking them together. Connect operators together and configure each operator's parameters to build the pipeline. Click an operator to configure it using the configuration tray on the right.
Operators are the building blocks for pipelines. Each operator is capable of operating on data in a stream but each has a specific function. To begin, drag-and-drop operators from the left-hand entity tree into the canvas.
Operators and nodes
The words operators and nodes are used interchangably within this document and within the user interface.
Types
Select from the following types of operator:
- Readers read data from an external or internal data source.
- Writers send data data to an internal or external data sink.
- Functions provide building blocks for transforming data by mapping, filtering or merging streams.
- Encoders map data to serialize data formats that can be shared out of the system with writers.
- Decoders deserialize incoming data into a kdb+ representation for manipulation.
- Windows group data into time blocks for aggregating streams.
- String Utilities perform string operations on data
- Transform operators provide low code and no code transformations for manipulating data.
- Machine Learning operators can be used to build prediction models of data in a stream.
Actions
When an operator is added, the right-click menu has a number of actions which can be done on the operator.
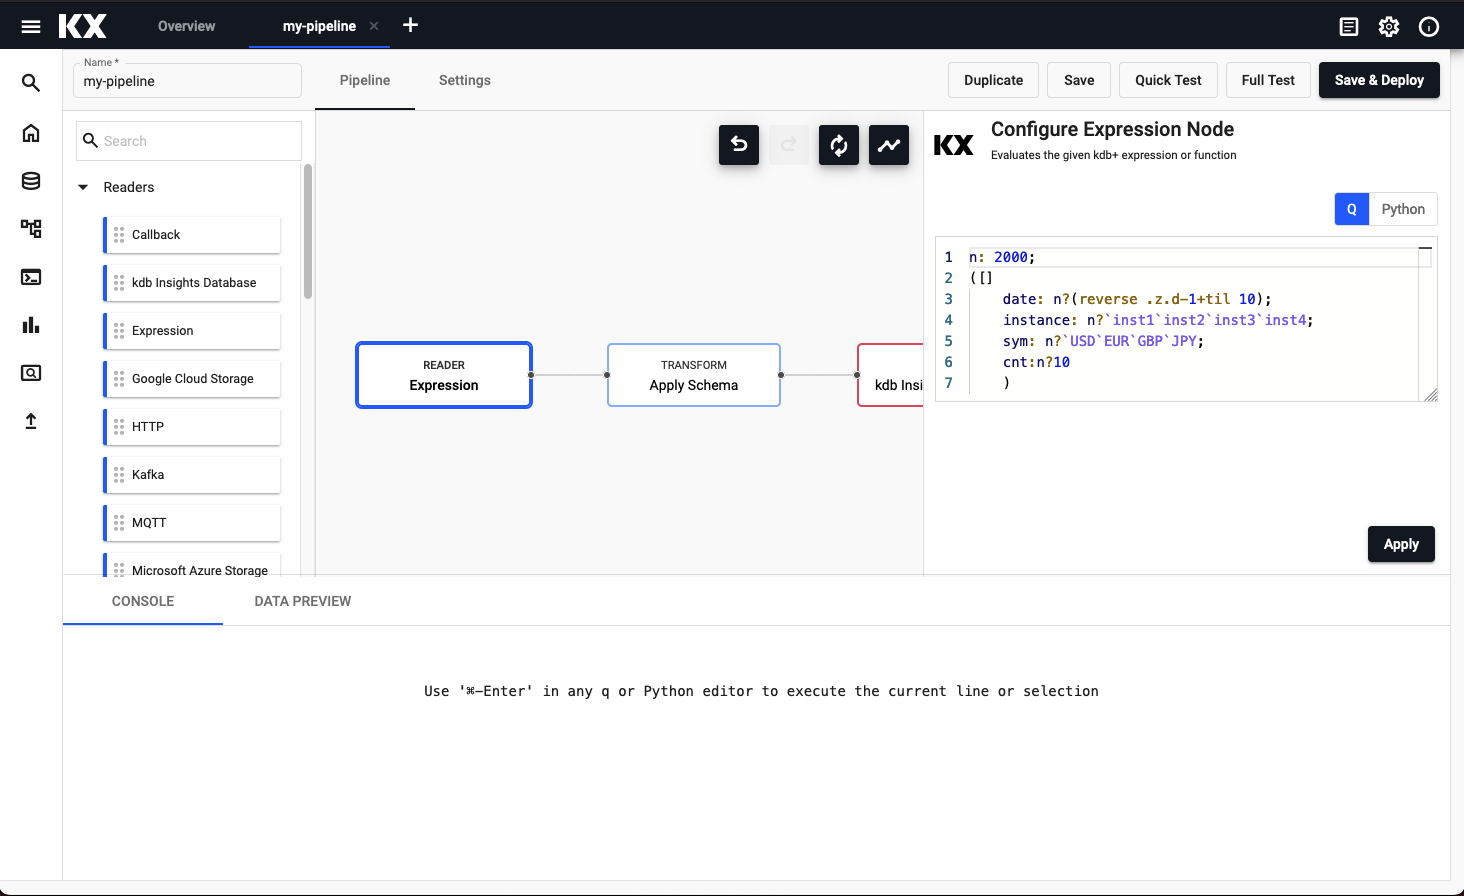
An example expression pipeline with reader, transformation and writer operator; right-click for menu options.
- Click an operator in the pipeline canvas to edit; this will update the pipeline settings with details of the operator.
- Right-click an operator in the pipeline canvas to rename, remove or duplicate an operator. A duplicated operator will retain the contents of the original, and will have the name appended with a numeric tag;
-n.
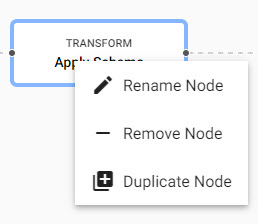
Right click menu on operator editing.
Building a pipeline
-
From the Document menu bar or Perspective icon menu on the left, create a new Pipeline by clicking the plus icon.
-
Click-and-drag an operator listed in the left-hand entity tree into the central workspace; for example, start with a Reader operator.
-
Build the pipeline by adding operators to the workspace and joining them with the operator-anchors. Operators can be removed on a right-click, or added by click-and-drag from the entity tree, or a right-click in an empty part of the workspace. To change a connection, rollover to display the move icon and drag-connect, remove with a right-click. A successful pipeline requires a reader and writer operator as a minimum.
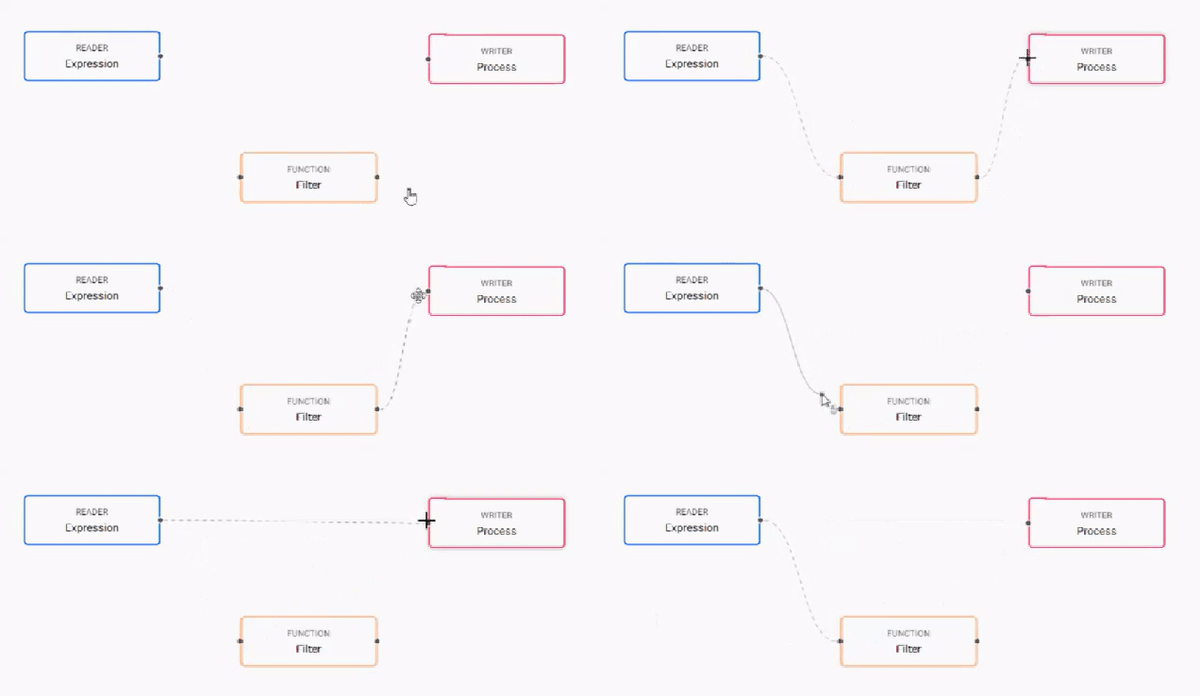
A connection of operators by linking to the connector edges together. -
Configure each of the pipeline operators; click-select to display operator parameters in the panel on the right.
Example Pipeline
Reader operator: Expression
n:2000;
([] date:n?(reverse .z.d-1+til 10);
    instance:n?`inst1`inst2`inst3`inst4;
    sym:n?`USD`EUR`GBP`JPY;
    cnt:n?10)
Transform operator: Apply Schema
Leave the
Data FormatasAny(required).Column Name Column Type Parse Strings date Timestamp Auto instance Symbol Auto sym Symbol Auto cnt Integer Auto Preferably, a table schema should be loaded from a database created using the database builder; select the database and schema table from their respective dropdowns. Use the above schema for the database
table.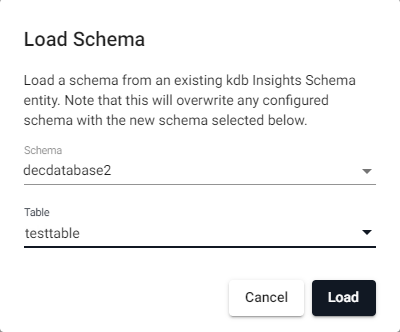
Load a schema from a database.will load
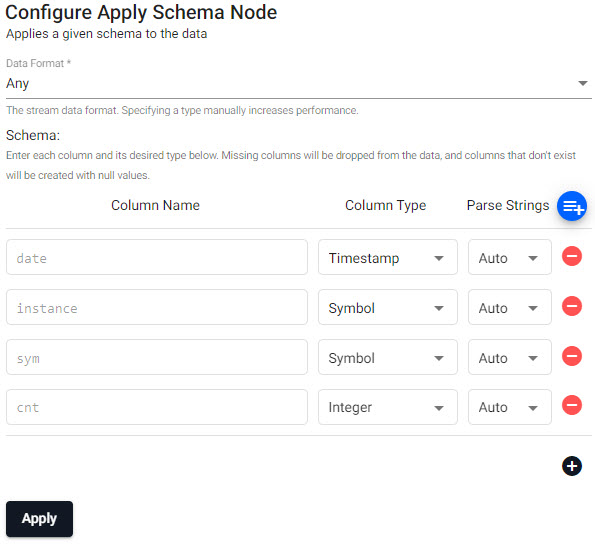
Predefined schema from database.Writer operator: kdb Insights Database
Use the existing
tablename to write the data to. If not already done, create a database.property setting Database yourdatabasename Table testtable Write to HDB unchecked Deduplicate Stream checked Completed Pipeline
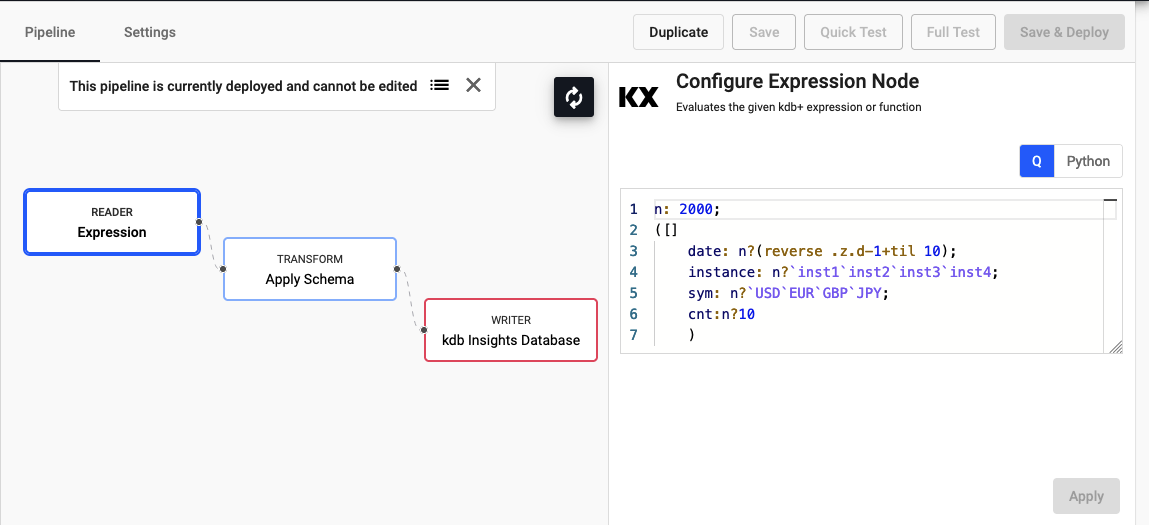
Completed expression pipeline after deployment.Schemas Require a Timestamp Partition Column
All schemas require a timestamp data column. In addition, the table should be partitioned and sorted (interval, historic and/or real-time) by this timestamp column. This can be configured as part of the set up database, or with the essential and advanced properties of a schema.
Executable Editors
All q or Python editors in node configuration are executable and can be used to interactively develop complex functions. The current selection or line can be executed using 'Ctrl-Enter' or '⌘Enter' and the output viewed in the Console tab in the bottom section of the pipeline editor.
-
Rename the pipeline by typing a new name into the name field in the top left corner. The pipeline name should be lowercase, only include letters and numbers, and exclude special characters other than
-. -
Click
Saveto save the pipeline. A pipeline can be associated with a database prior to deployment, or deployed directly to an active database.Database selection
If not previously created, create a database before configuring. The initial database will have a default table (and schema); additional tables can be added to the database schema.
-
Deploy the database associated with the pipeline. When the database is ready to be queried it will show a green circle with a tick next to it. The pipeline will appear under Pipelines of the Overview page, and show as
Running.Test Deploys
A quick or full test deploy can be done by clicking the respective test type in the pipeline page. Results will be displayed in the Data Preview tab of the lower panel of the pipeline editor - click on an operator to see the results at each step along the pipeline. Test deploys will automatically be torn down after completion of the test. See test deploy for more details.
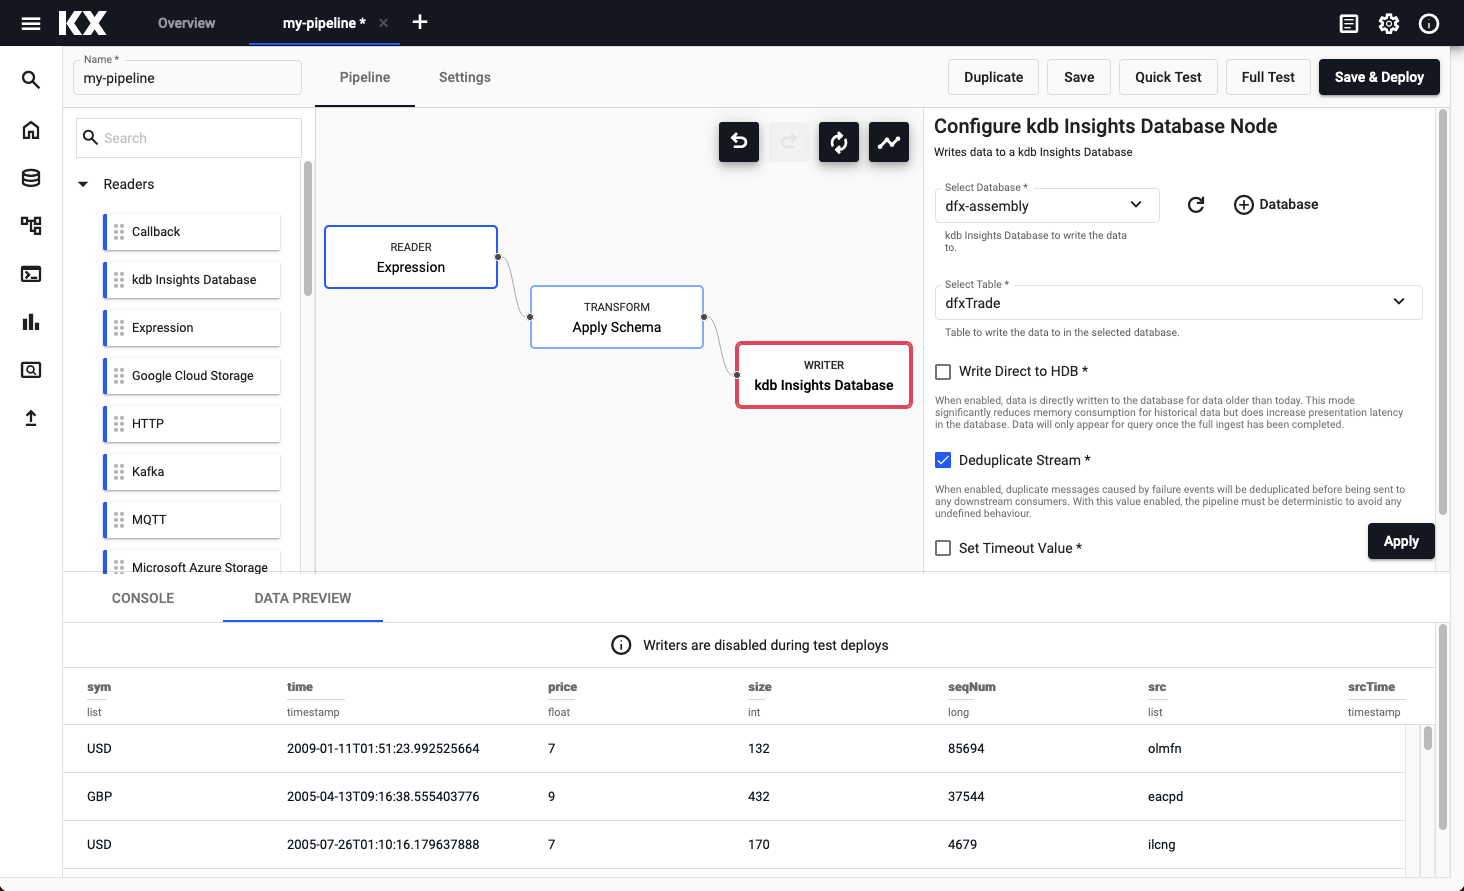
Results from a test deployment of an Expression pipeline.
A running pipeline as shown in the Overview page. -
Open a Query workspace from the ribbon "+" menu, or from the icon bar on the left. Then open the SQL tab, and in the SQL editor add for the aforementioned Expression example:
SQL query
SELECT * FROM testtable
-
Get Data
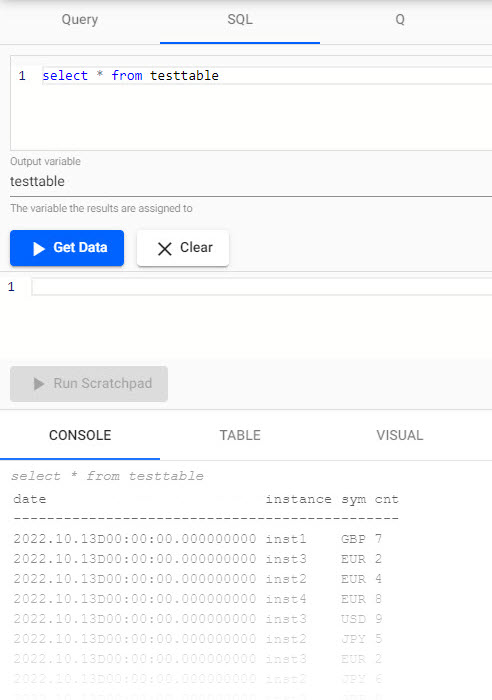
Console output of SQL query.
Set up
In order to use Kafka and Postgres pipelines, relevant charts must be installed, running, and accessible on the cluster.
Lower Case required
When configuring pipelines, lower case should be used in all instances of names and references.
Take a look at some of the guided walkthrough pipeline examples.
Pipeline status
The status of a pipeline is available on the Overview page under "Running pipelines":

View the state of the pipeline, teardown the pipeline, view diagnostics, or click the pipeline name to open its pipeline template view.

To view the logs for a pipeline, click the "View Diagnostics" button.

To teardown a pipeline, click the "Teardown" button.
A pipeline can have the following statuses:
CREATING- Pipeline SP Controller is being createdINITIALIZING- Pipeline SP Controller has been createdPARTITIONING- Pipeline is in the process of distributing partitions among one or more WorkersREADY- Pipeline is ready to start, but is not yet processing messagesRUNNING- Pipeline is running and processing messagesUNRESPONSIVE- Pipeline SP Controller is not responsing to HTTP requestsERRORED- Pipeline errored before starting. This does not include errors encountered while processing messagesTEARING_DOWN- Pipeline is in the process of tearing downFINISHED- Pipeline has finished processing messages, but has not been torn downNOTEXIST- Pipeline does not exist
Pipeline settings
Clicking the Settings tab will allow changing the pipeline resources, environment variables and tuning pipeline settings. See pipeline settings for more details.
Deploying, Testing, and Saving
Duplicate
Creates a copy of the pipeline.
- Pipeline name
- Give the duplicate pipeline a name. The duplicate pipeline name should be lowercase, only include letters and numbers and have a different name to the original pipeline, while excluding special characters other than
-.
Save
Save the pipeline.
Quick test
Run a quick test deploy in the scratchpad to validate that the pipeline works. See test deploys for more information.
Full test
Run a full test deploy using worker and controller pods to validate that the pipeline works. See test deploys for more information.
Deploy
Deployed pipelines are deployed indefinitely. If a deployed pipeline errors, it will remain deployed. A deployed pipeline can be torn down from the pipeline listing, or from the banner that appears when the pipeline is deployed. Note that it is recommend that a test deploy is run before running a pipeline normally, as test deploys let you validate the output without writing from the writers.
Graph options
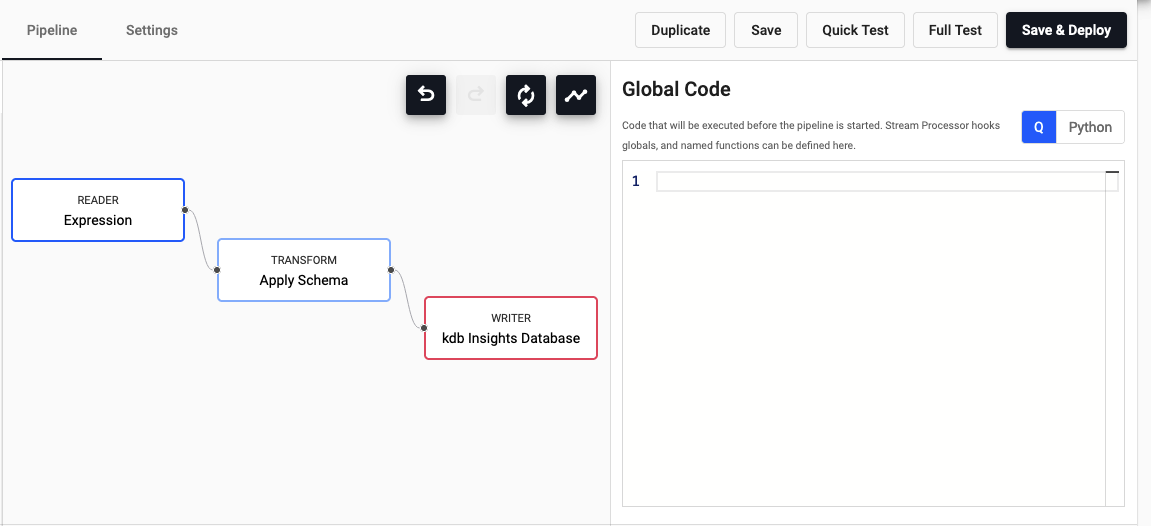
Pipeline canvas options and configuration properties.
| icon | function |
|---|---|
 |
Undo change |
 |
Redo change |
 |
Reset view |
 |
Automatically layout pipeline |
Operator configuration
When an operator is selected, the right-hand panel contains the configuration details for the selected operator.
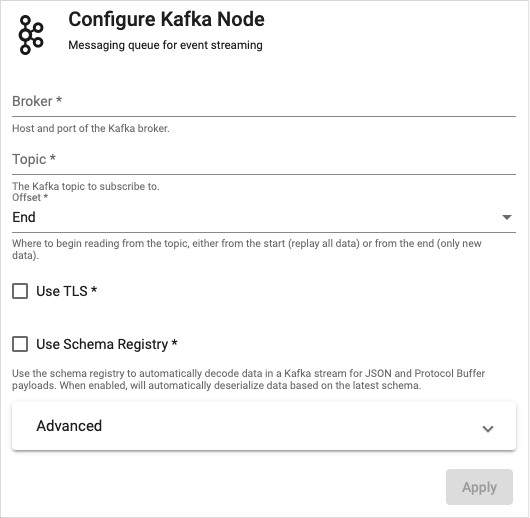
Pipeline properties for a Kafka import.
Global code
When no operator is selected, the right-hand panel contains the Global Code configuration. Global Code is executed before a pipeline is started; this code may be necessary for Stream Processor hooks, global variables and named functions.
Python code within pipeline UI
Development of stream processor pipelines within the UI provides the ability for logic to be written in Python. The following sections of documentation outlines requirements and caveats which you should bear in mind when developing such nodes.
Writing Python code within the pipeline UI
When defining the code which is to be used for a given node you need to take the following into account:
- The parsing logic used to determine the function used within a Python node works by retrieving for use the first function defined within the code block. The entire code block will be evaluated but it is assumed that the first function defined is that is retrieved is that used in execution.
- Only Python functions are supported at this time for definition of the execution function logic. You should not attempt to use
lambdasor functions within classes to define the execution logic for a node. Additionally while functions/variables defined within the global code block can be used within individual nodes they cannot be referenced by name as the definition of the function to be used. - All data entering and exiting an executed Python node block will receive and emit it's data as a
PyKXobject. The PyKX documentation provides outlines on how these objects can be converted to common Python types and additionally includes notes on performance considerations which should be accounted for when developing code which interacts with PyKX objects.
The following provides an example of a map and filter node logic which could be used on a pipeline:
import pykx as kx

def map_func(data):
    # compute a three window moving average for a table
    return kx.q.mavg(3, data)
    # Function expected to return a list of booleans
    # denoting the positions within the data which are to
    # be passed to the next node
def filter_func(data):
        return kx.q.like(data[0], b"trades")