Explore
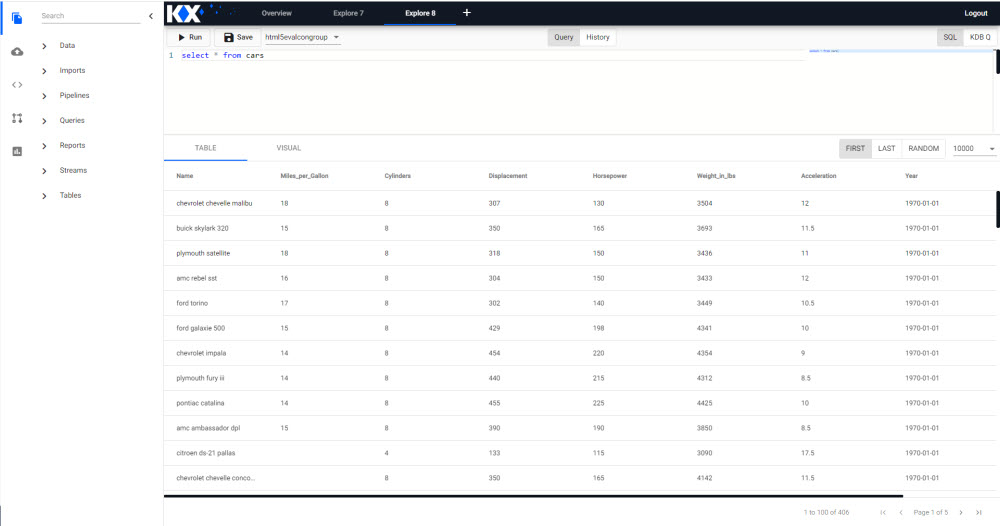
Explore lets you query your data using kdb+/q or sql. The dropdown shows the available assemblies along with any gateway processes. Freeform queries can be run against these and output will be shown in the table or chart below.
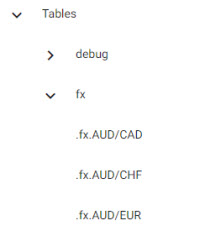
Data can also be accessed from the list of assemblies in the entity tree. Historic data is available directly under the assembly while Intraday and Realtime data are nested.
The central divider is a drag bar which can be resized to better view the query or outputted results.
Set up
-
import data to create a running pipeline or select a table from an available assembly. Check the Overview tab for a list of pipelines and their status.
-
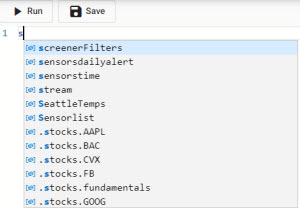
The Explore editor will return selectable datasets as you type. Datasets can also be queried using either sql or kdb+/q.
html5evalcongroupselect * from cars
idbselect * from trace LIMIT 5 -
Saveand/orRun
Sandbox
Explore offers a sandbox environment for querying read-only data from a list of available assemblies. Assemblies are listed in the dropdown next to the Save icon. Data can be queried using sql or kdb+/q.
Options
Save
Save the query to local browser storage. Data can be accessed between browser sessions.
Run
Executes the query. Results will be outputted in the lower Table or Visual panel.
CTRL+ Enter
Queries can be run using the keyboard shortcut of CTRL+ Enter.
Query
A text-based kdb+/q editor. A smart autofill will list available data tables on running pipelines.
History
A log of executed queries and their status. To rerun a query, click the play icon on the left.
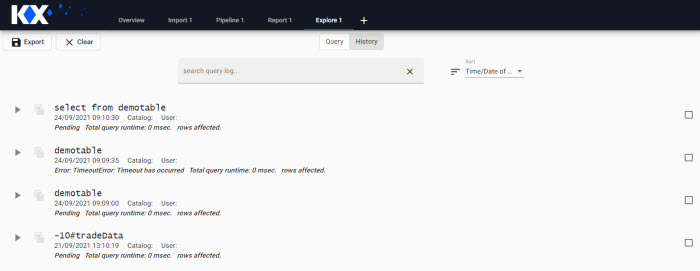
Additional options available when check-selected are:
Export
Export the query
Clear
Remove from the log history
Search
Search the log history
Sort
Sort history by Query, Time/Date of Query, User, Execution Time, Query Success, Editor Language. A toggle switches the order from ascending to descending.
Table
Tabulated results from the query; results are paged.
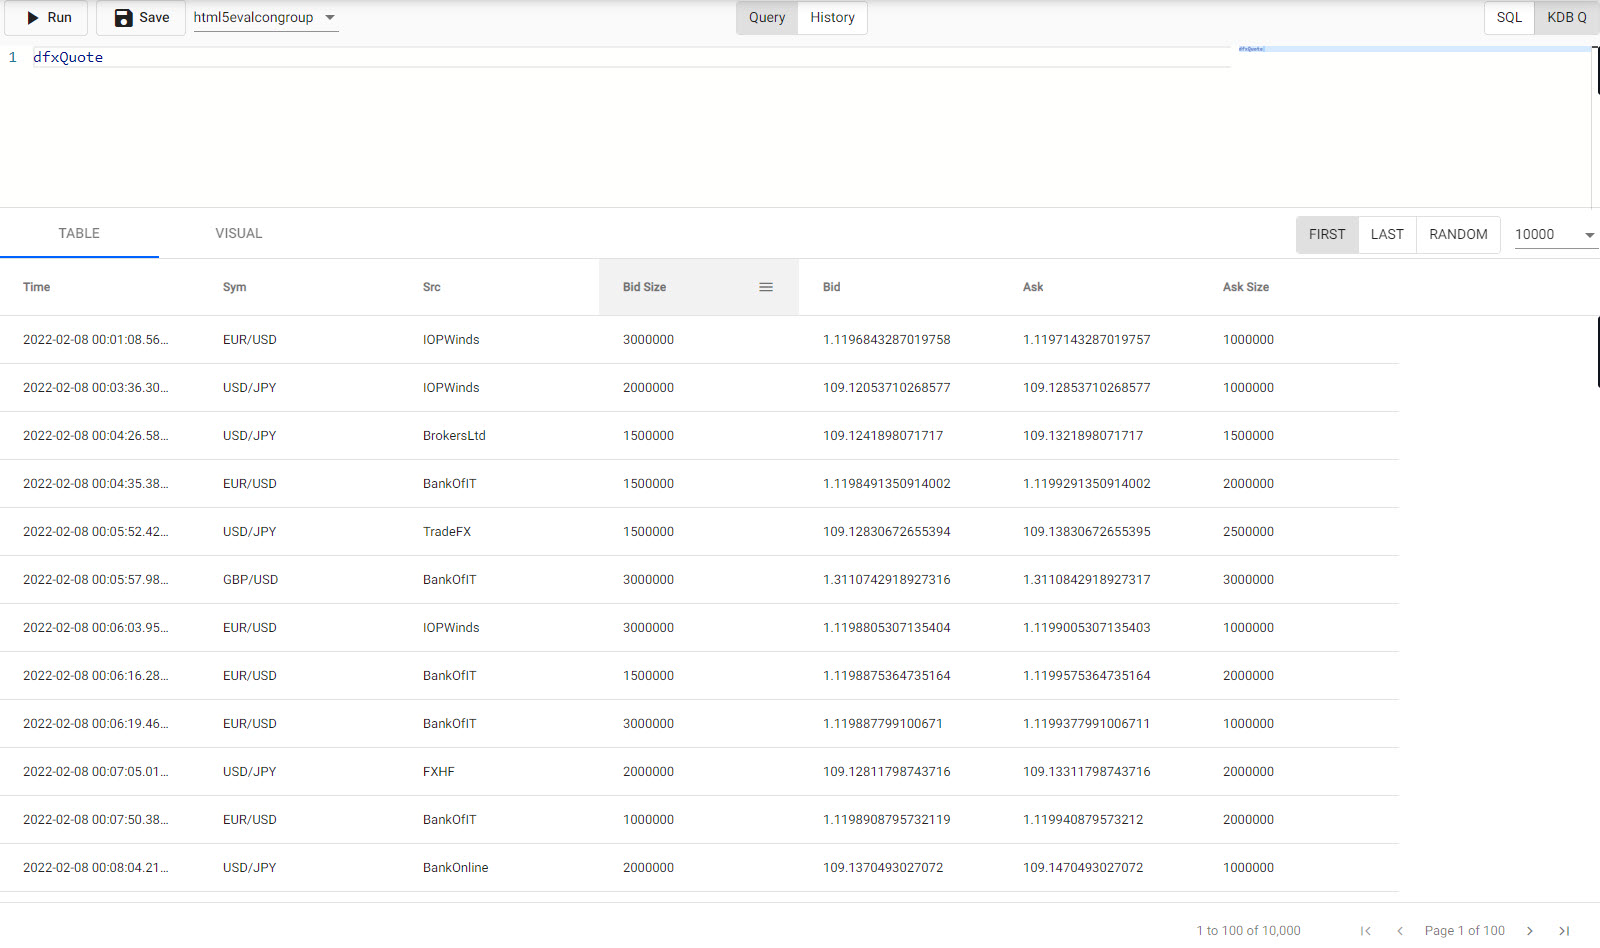
- First
- Display results from the start of the data source (page 1).
- Last
- Display results from the end of the data source (last page).
- Random
- Select a random point in the data set to display results.
- 10
- 100
- 1000
- 10000
- Filter paged results by
10,100,1,000, or10,000results per page.
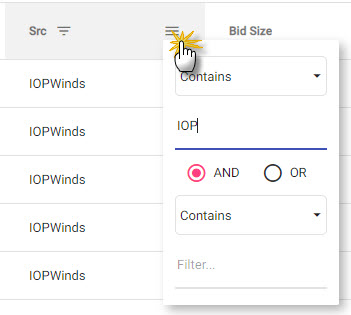
Column Filter
Data columns can be sorted in ascending and descending order on a header click.
Support for data filtering with AND/OR statements available as a dropdown menu option in the header; select between contains, not contains, equals, not equal, starts with, or ends with.
Visual
A chart of the result data; double click on an item to edit.
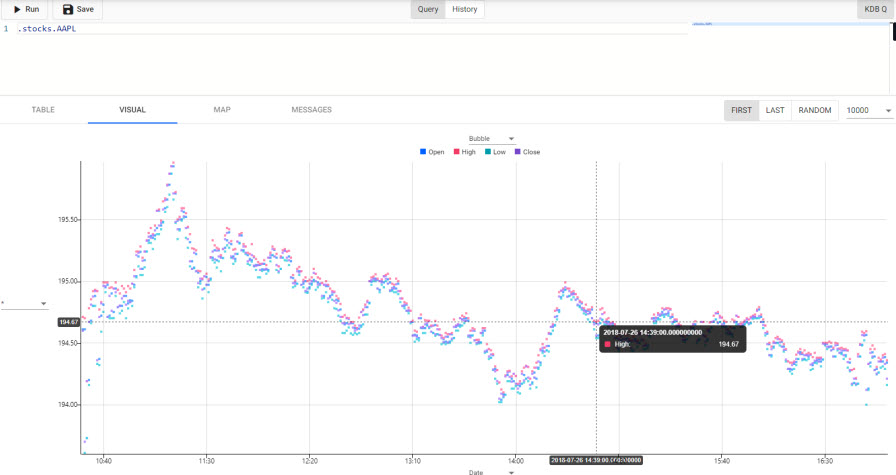
Chart Type
Select from Bubble, Line or Bar.
Define the data source variables to chart from the x- and y-axis drop-downs. Defaults to wildcard, *, for y-axis.
Display
Click the area above the chart to open menu.
Bubble
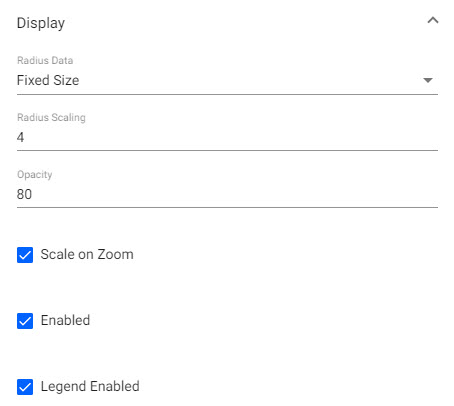
- Radius Data
- Choose between a data source variable or
Fixedsized bubbles. - Radius Scaling
- Sets the scaling of bubble size.
- Opacity
- Define the opacity of the bubble. Range 0 (transparent) to 100 (opaque).
- Scale on Zoom
- When enabled, bubbles will scale on zoom; increase in size on zoom in, decrease in size on zoom out.
- Enabled
- Plotted bubble data will display on chart when enabled.
- Legend Enabled
- Legend of plotted data will appear above chart when enabled.
Line
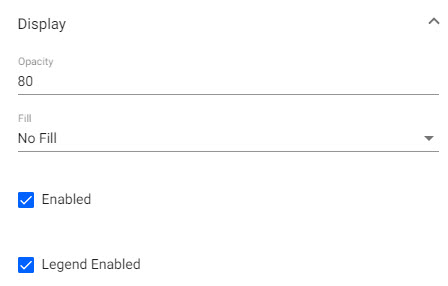
- Opacity
- Define the opacity of the line. Range 0 (transparent) to 100 (opaque).
- Fill
- Fill Color
- Fill Opacity
- Fade to Transparent
- Enable to fill the area of the line to the x-axis. Define Hex color, opacity of the fill area and optional transparency fade.
- Enabled
- Plotted line data will display on chart when enabled.
- Legend Enabled
- Legend of plotted data will appear above chart when enabled.
Bar
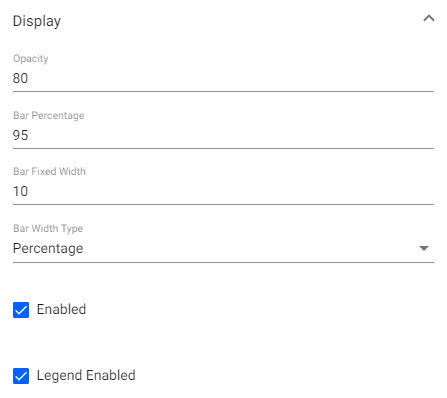
- Opacity
- Define the opacity of the bar. Range 0 (transparent) to 100 (opaque).
- Bar Percentage
- Set auto-size percentage width of bars
- Bar Fixed Width
- Set bar width in pixels.
- Bar Width Type
- Toggle between
PercentageorFixed Widthfor bar width. - Enabled
- Plotted bar data will display on chart when enabled.
- Legend Enabled
- Legend of plotted data will appear above chart when enabled.
Color Palette
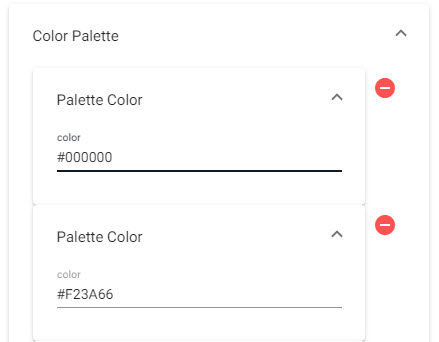
Define Hex color for each layer; plotted in order.
Animation
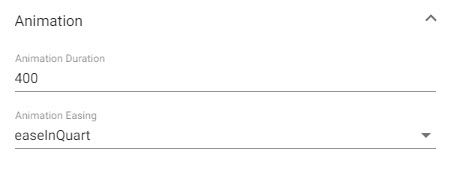
- Animation Duration
- Animation Easing
- Define zoom animation events and length of time in milliseconds to complete. Select from
swingFromTo,swingFrom,swingTo,easeFromTo,easeFrom,easeTo,easeInQuad,easeOutQuad,easeInOutQuad,easeInCubic,easeOutCubic,easeInOutCubic,easeInQuart,easeOutQuart,easeInOutQuart,easeInQuint,easeOutQuint,easeInSine,easeOutSine,easeInOutSine,easeInExpo,easeOutExpo,easeInOutExpo,easeInCirc,easeOutCirc,easeInOutCirc,easeOutBounce,easeInBack,easeOutBack,easeInOutBack,bounce,bouncePast,elastic.
Overlay
- Show Crosshairs
- Adds a crosshair to the chart.
- Show Coordinates
- Displays axis values for cursor position in chart.
- Snap Crosshair to Data
- Crosshair position locks to y-axis value relative to x-axis postion.
- Show all data points
- Crosshair displays all values in tooltip at x-axis position.
- Group tooltip by layer
- Group display of chart values in the tooltip by data layers.
X- and Y-Axis
- Number of Ticks
- Define number of tick labels to display in the y-axis.
Range
- Use min max
- Min
- Max
- Use minimum and maximum values of data range to define y-axis range.
Gridlines
- Offset Gridlines
- When enabled, sets gridlines between tick values.
- Gridlines Opacity
- Defines the opacity of gridlines from
0(transparent) to100(opaque).
Format
- Display
- When enabled, displays tick values.
- Begin at Zero
- When enabled, plotted values will start at 0 for the y-axis.
- Numeric Format
- Select between
Number,Smart NumberandFormatted Number. - Decimal Places
- Define precision of y-axis labels.
- Font size
- Define font-size of tick labels.
- Prefix
- Suffix
- Add a text component before or after y-axis tick label.
- Hide Trailing Zeroes
- When enabled, hides trailing zeroes from axis label.
- 10
- 100
- 1000
- 10000
- Filter paged results by
10,100,1,000, or10,000results per page.