Logging
Build a simple Hello World application using QLog and cloud logging services; explore QLog features
Hello world
A simple application to print some logging to stdout. Execute the following:
cd ${HOME}/KxCloudEdition/examples/qlog/qlog-qs

# build & run
qp build
qp run
The output will be a structured, timestamped, JSON log message.
{"time":"2021-01-26T15:18:02.287z","component":"qlog","level":"INFO","message":"Hello world!"}Basics for more on the APIs and a breakdown of the script
Configuring qlog
Qlog can be configured from a file. This can be used to automatically setup endpoints, configure the format and set routing on initialisation.
This is configured by setting the KXI_LOG_CONFIG to point to JSON file.
A sample file is provided.
cd ${HOME}/KxCloudEdition/examples/qlog/qlog-qs
echo '{"endpoints":["fd://stderr"],"formatMode":"json","routings":{"DEFAULT":"INFO","qlog":"DEBUG"}}' > qlog.json
qp build
. qpbuild/.env
docker run -it --rm --env-file=./qpbuild/.env --env KXI_LOG_CONFIG=/opt/kx/app/qlog.json ${default} -p 5000
Logging agent
How logs can be collected by an agent and routed to other cloud services
Here we will use the Fluent Bit agent and the Hello World example from the previous section. The agent can be configured to route to cloud logging applications or other endpoints.
Docker Compose and Kubernetes
This walkthrough uses Docker Compose for simplicity. It is likely Kubernetes would be preferred for production.
The same Fluent Bit agent can be set up to run in a Kubernetes application as a DaemonSet. This process is relatively straightforward and well documented online: the offical guide looks at both Kubernetes and Helm.
Here we run two Docker containers: one for the application, and one for the agent. The application’s logging is forwarded to the agent, which initially simply dumps it to its own STDOUT.
Requires docker-compose version 1.25+
cd ${HOME}/KxCloudEdition/examples/qlog/qlog-qs
qp build
docker-compose -f docker-compose.yml --env-file=./qpbuild/.env up
As below, the client application output is seen from the Fluent container. So the routing is working successfully. Press Ctrl-C to shut down. Ignore the warning that no logs are available: this is by design.
..
fluent    | [0] 247202086d68: [1611761398.000000000, {"log"=>"INFO: Using existing license file [/opt/kx/lic/kc.lic]", "container_id"=>"247202086d680f33f1f9e50ab383c0b7935d35cd0847652ba36ea2260b0d38c5", "container_name"=>"/hello", "source"=>"stdout"}]
fluent    | [1] 247202086d68: [1611761398.000000000, {"log"=>"RUN [q startq.q ]", "container_id"=>"247202086d680f33f1f9e50ab383c0b7935d35cd0847652ba36ea2260b0d38c5", "container_name"=>"/hello", "source"=>"stdout"}]
fluent    | [0] 247202086d68: [1611761399.000000000, {"component"=>"qlog", "level"=>"INFO", "message"=>"Hello world!", "container_id"=>"247202086d680f33f1f9e50ab383c0b7935d35cd0847652ba36ea2260b0d38c5", "container_name"=>"/hello", "source"=>"stdout"}]
hello exited with code 0
The agent is highly pluggable and supports a variety of different output types.
If you are running on a cloud platform, let’s update it to do something more useful.
Each of the cloud providers has its own logging application and we can configure the
agent to route to there. We can switch between providers by setting the FLUENT_CONFIG environment variable.
GCP      gcp.conf
AWS      aws.conf
Azure    azure.conf
GCP
Execute the following to rerun the example and output to Google Cloud Logging.
export FLUENT_CONFIG=gcp.conf
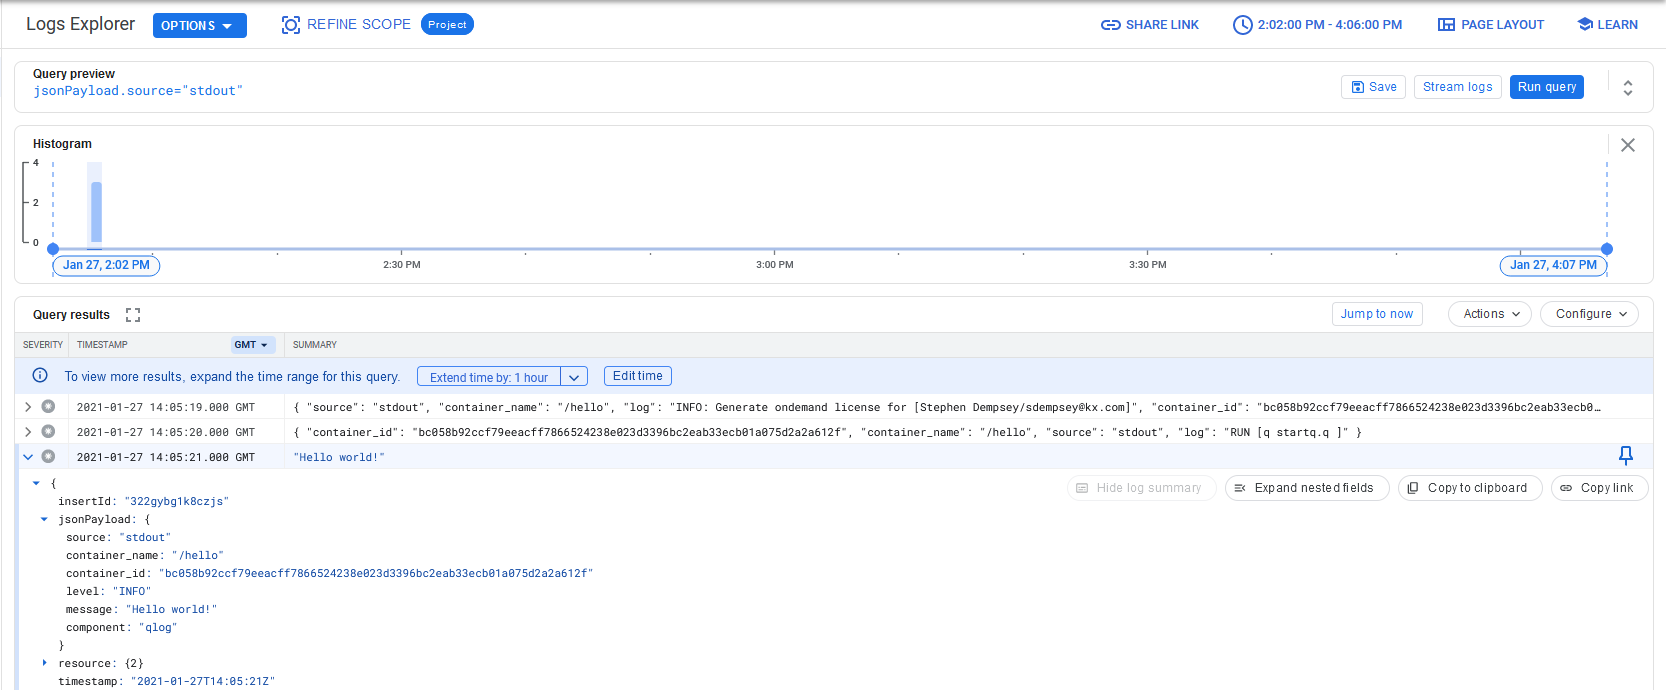
docker-compose -f docker-compose.yml --env-file=./qpbuild/.env upOpen the Logs Explorer and it should contain the Hello world! message.
In the Query builder pane, enter jsonPayload.source="stdout" to filter the dataset.
AWS
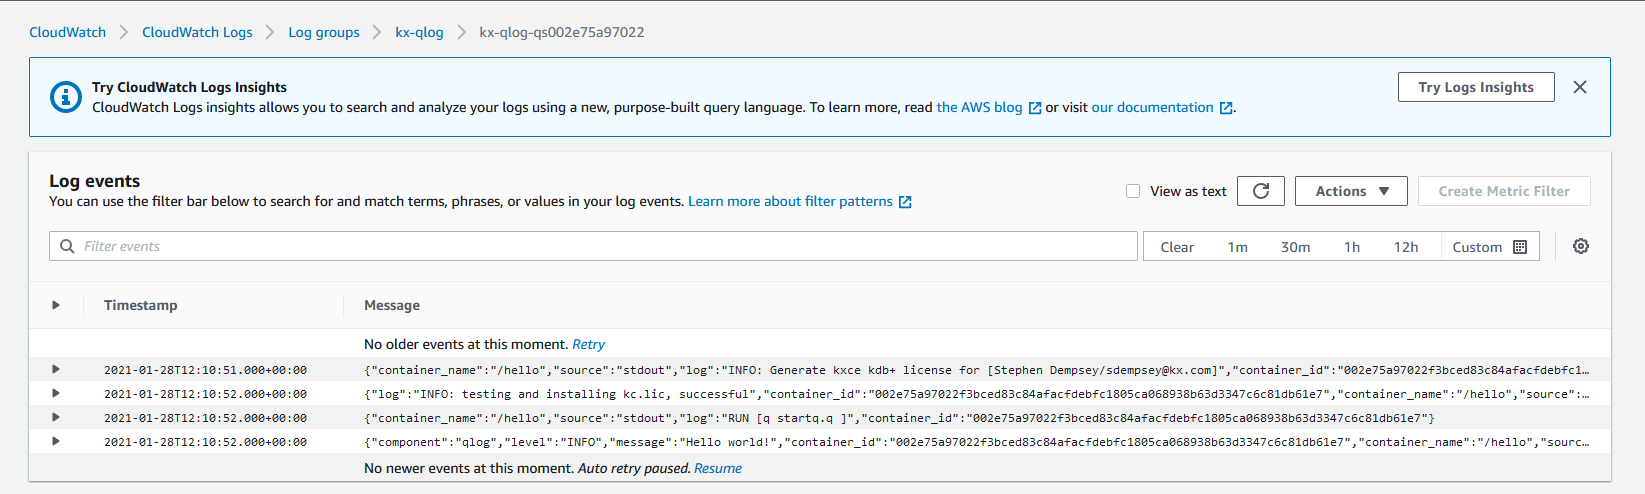
Execute the following to rerun the example and output to Amazon CloudWatch Logs.
export FLUENT_CONFIG=aws.conf
docker-compose -f docker-compose.yml --env-file=./qpbuild/.env up
The uploaded logs should be available on AWS.
Azure
Azure requires some additonal setup.
- Create a Log Analytics workspace
- Using the Azure portal locate the newly created workspace in Log Analytics workspaces. Open
Agents ManagementunderSettingsand locate theWorkspace IDandPrimary Key. - Replace the
<WORKSPACE_ID>in thefluent/conf/azure.confwith theWorkspace IDfrom #2. - Replace the
<AUTH_KEY>in thefluent/conf/azure.confwith thePrimary Keyfrom #2.
Execute the following to rerun the example and output to Azure Monitor Logs.
export FLUENT_CONFIG=azure.conf
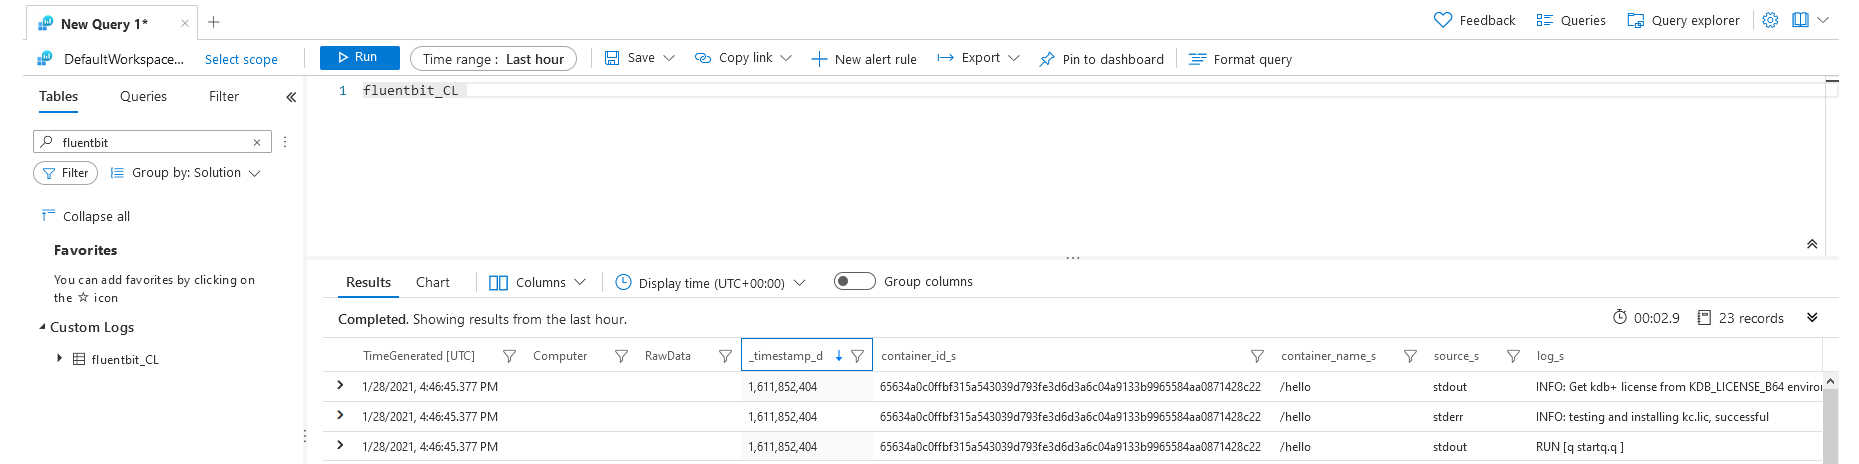
docker-compose -f docker-compose.yml --env-file=./qpbuild/.env upThe uploaded logs should be available in the Log Analytics workspaces.
It may take a few seconds for the first upload of logs to appear
Locate the log messages using Azure Portal:
1. Locate the workspace in Log Analytics workspaces.
2. Navigate to Logs under General.
3. At the query interface type fluentbit_CL and run the query.
4. A result will be displayed similar to screenshot below(amend the date time range if necessary).
Examples
The code for each example is available in
${HOME}/KxCloudEdition/examples/qlog/qlog-examples/src
The script name corresponds to the qp run parameter to run it; e.g. in the quickstart example, do the following.
cd $HOME/KxCloudEdition/examples/qlog/qlog-examples
qp run quickstart -- -debug
The code would be available in src/quickstart.q.
The -debug flag keeps the process running interactively to dive deeper.
Basics
Examine the earlier Quick Start example.
src/quickstart.q
id:.com_kx_log.init[`:fd://stdout; ()]
.qlog:.com_kx_log.new[`qlog; ()]

.qlog.info["Hello world!"]

if[not `debug in key .Q.opt .z.x; exit 0]
Look at the .qlog dictionary. Each element corresponds to a different
log level. We can print messages using two handlers to compare. Note the difference in the level field.
q).qlog
trace| locked[`TRACE;`qlog]
debug| locked[`DEBUG;`qlog]
info | locked[`INFO;`qlog]
warn | locked[`WARN;`qlog]
error| locked[`ERROR;`qlog]
fatal| locked[`FATAL;`qlog]

q).qlog.info["Process starting"]
{"time":"2021-01-26T16:33:21.396z","component":"qlog","level":"INFO","message":"Process starting"}

q).qlog.fatal["Process crashing"]
{"time":"2021-01-26T16:33:21.397z","component":"qlog","level":"FATAL","message":"Process crashing"}
Create a new logging component. Where levels are used to distinguish the severity of
messages, components can be used to distinguish the source of a message. A component can be a module,
a process or any other grouping that makes sense for the application. Below we create another set of logging APIs
for a Monitor component. Note the change in the component field.
q).mon:.com_kx_log.new[`Monitor; ()];
q).mon.info["Monitor starting"];
{"time":"2021-01-26T16:37:50.768z","component":"Monitor","level":"INFO","message":"Monitor starting"}
Routing
Log messages can be routed or suppressed according to their severity. Often applications will suppress all debug or trace logs. Each logging component can set its own level routing.
QLog has the following list of levels, in ascending order
of severity: TRACE, DEBUG, INFO, ERROR, FATAL.
This example initializes the STDOUT endpoint with a default routing of INFO.
Messages will be logged with severities of INFO or above. Anything below that will
be suppressed.
$ qp run routing1
..
{"time":"2021-01-26T17:19:38.113z","component":"qlog","level":"INFO","message":"Info"}
{"time":"2021-01-26T17:19:38.113z","component":"qlog","level":"ERROR","message":"Error"}
{"time":"2021-01-26T17:19:38.113z","component":"qlog","level":"FATAL","message":"Fatal"}
The routing2 example shows how to route severities by component,
and routing3 illustrates how to configure different routings per endpoint when several are set up.
Message formatting
It is common for log messages to include the values of variables or process state. These are often built into the message body. Often it is the responsibility of the client to do this parsing. QLog supports a token-based method of doing this in the APIs. The client can provide a list containing the message body and variables to be automatically parsed into a string.
q).qlog.info ("Complex list format with an int=%1 and a dict=%2"; rand 10; `a`b`c!til 3)
{"time":"2021-01-27T11:24:10.393z","component":"qlog","level":"INFO","message":"Complex list format with an int=9 and a dict=`a`b`c!0 1 2"}
The logging string should contain tokens from %1 to %N, corresponding to the number
of variables.
Dictionary inputs are supported and are appended to the log message. It must include
a message key for the actual log body. Other keys will be appended to the output.
Run the following for an example
$ qp run formatting
..
{"time":"2021-01-27T11:24:10.392z","component":"qlog","level":"INFO","message":"Simple message"}
{"time":"2021-01-27T11:24:10.393z","component":"qlog","level":"INFO","message":"Dictionary message","labels":["rdb","eod"]}
{"time":"2021-01-27T11:24:10.393z","component":"qlog","level":"INFO","message":"Complex list format with an int=9 and a dict=`a`b`c!0 1 2"}
{"time":"2021-01-27T11:24:10.393z","component":"qlog","level":"INFO","message":"Complex dict format with an int=5 and a dict=`a`b`c!0 1 2","labels":["rdb","eod"]}
Log metadata
A common use case when logging is to include some metadata with logs. There are two types supported: correlators and service details.
- Service details
-
are set globally on the process and appended to each message
- Correlators
-
are set globally as part of an event and appended to each message
For example, each incoming request would be assigned its own correlator and any logs emitted as part of that request would contain the same correlator.
This example starts up with some basic logging, simulates receiving a request
and shutting down. Note the corr field in the middle two log messages.
$ qp run metadata
..
{"time":"2021-01-27T11:38:17.989z","component":"Monitor","level":"INFO","message":"Process initialised","service":"rdb","PID":1}
{"time":"2021-01-27T11:38:17.989z","corr":"d13b7c7c-6d0f-5d56-7eb0-5e029c9f4609","component":"Monitor","level":"INFO","message":"API request received from kf","service":"rdb","PID":1}
{"time":"2021-01-27T11:38:17.990z","corr":"d13b7c7c-6d0f-5d56-7eb0-5e029c9f4609","component":"Monitor","level":"DEBUG","message":"Request complete","service":"rdb","PID":1}
{"time":"2021-01-27T11:38:17.990z","component":"Monitor","level":"INFO","message":"Shutting down","service":"rdb","PID":1}
REST endpoints
QLog can also log directly to the cloud applications over REST. The following example applications illustrate this. Each require extra parameters and they can be passed into the container as shown:
qp run gcpRest -- <PROJECT ID> -debug

# <PROJECT ID> can be retrieved using `gcloud config get-value project`
qp run awsRest -- <AWS_ACCESS_KEY_ID> <AWS_SECRET_ACCESS_KEY> <REGION> <LOG GROUP> <LOG STREAM> -debug

# <AWS_ACCESS_KEY_ID> <AWS_SECRET_ACCESS_KEY> are your account access secrets
# <REGION> is the service region
# <LOG GROUP> <LOG STREAM> can also be found Cloudwatch UI - https://docs.aws.amazon.com/AmazonCloudWatch/latest/logs/Working-with-log-groups-and-streams.html
qp run azureRest -- <PRIMARY KEY> <WORKSPACE ID> <LOGNAME> -debug

# <PRIMARY KEY> and <WORKSPACE ID> parameters can be obtained from the Agent Management section in Log Analytics workspaces
# <LOGNAME> is an arbitrary name. The log messages can be viewed in the Log Analytics workspace by querying for <LOGNAME>_CL
Summary
We have seen how to build and run a basic application with QLog. We have introduced the concept of the logging agent.