MapboxMap
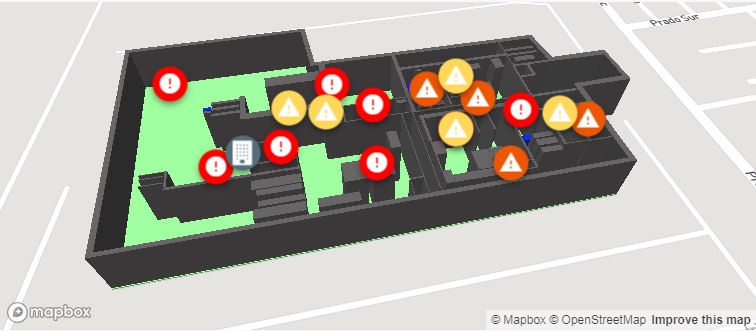
A Map with a 3D Overlay
Displays a geographical map that can contain a 3D overlay.
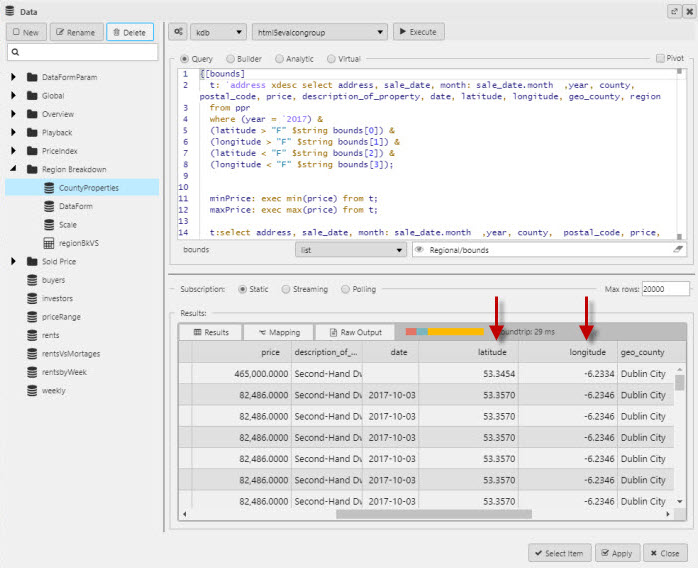
Set up
-
Define a data source with Latitude, Longitude, Marker Type, Title, Sub Title, Color, and Icon data.
-
Set JSON overlay for map polygon image.
-
Set the API access token in Map Box Key.
-
Create optional view state parameters for map elements.
Map
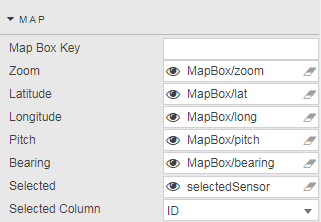
- Map Box Key
- Access token for the API.
- Zoom
- The map’s current zoom level.
- Latitude
- The latitude for the map’s geographical centre point.
- Longitude
- The longitude for the map’s geographical centre point.
- Pitch
- The map’s current tilt level.
- Bearing
- The map’s current rotation level.
- Selected
- Selected values.
- Selected Column
- The column used for the selected attribute.
Points
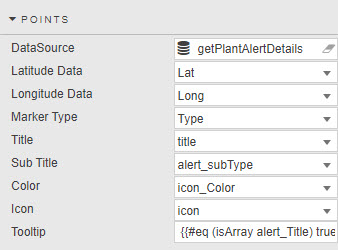
Plots distinct data points on the map.
- Latitude / Longitude
-
Data Source columns for latitude and longitude.
Latitude and longitude columns in the Data Source - Marker Type
- Data Source columns for a standard point or a simplified point.
- Title / Sub Title
- Data Source columns for point title and sub title.
- Color / Icon
- Data Source columns for point color and icon.
- Tooltip
-
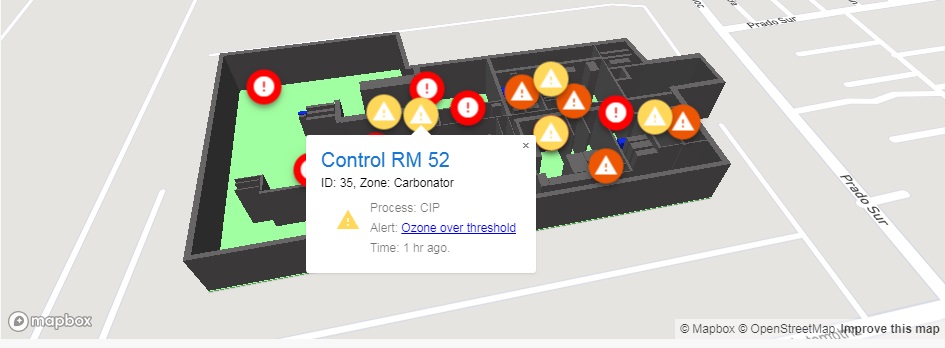
Tooltip on a Mapbox
Overlay
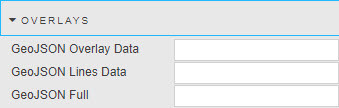
Mapbox overlay
- GeoJSON Overlay Data
- Define JSON Source for polygon overlays; example:
{
"type": "FeatureCollection",
"features": [ {
"type": "Feature",
"properties": {
"stroke": "#555555",
"stroke-width": 2,
"stroke-opacity": 1,
"fill": "#555555",
"fill-opacity": 0.5,
"color": "#99ff99",
"height": 1
},
"geometry": {
"type": "Polygon",
"coordinates": [ [
[ -99.59863364696503, 19.298921787061122 ],
[ -99.59863901138306, 19.297061132726533 ],
[ -99.59517359733582, 19.297078853343795 ],
[ -99.59518432617188, 19.297807928504646 ],
[ -99.59477663040161, 19.297802865493896 ],
[ -99.5947927236557, 19.29815727586803 ],
[ -99.59525138139725, 19.29815727586803 ],
[ -99.5952969789505, 19.298455992587193 ],
[ -99.59714233875275, 19.298471181558355 ],
[ -99.59716647863388, 19.298921787061122 ],
[ -99.59863364696503, 19.298921787061122 ]
]
]
}
}
]
}- GeoJSON Line Data
- JSON Line Overlay; example:
{
"type": "Feature",
"properties": {},
"geometry": {
"type": "LineString",
"coordinates": [
[-122.48369693756104, 37.83381888486939],
[-122.48348236083984, 37.83317489144141],
[-122.48339653015138, 37.83270036637107],
[-122.48356819152832, 37.832056363179625],
[-122.48404026031496, 37.83114119107971],
[-122.48404026031496, 37.83049717427869],
[-122.48348236083984, 37.829920943955045],
[-122.48356819152832, 37.82954808664175],
[-122.48507022857666, 37.82944639795659],
[-122.48610019683838, 37.82880236636284],
[-122.48695850372314, 37.82931081282506],
[-122.48700141906738, 37.83080223556934],
[-122.48751640319824, 37.83168351665737],
[-122.48803138732912, 37.832158048267786],
[-122.48888969421387, 37.83297152392784],
[-122.48987674713133, 37.83263257682617],
[-122.49043464660643, 37.832937629287755],
[-122.49125003814696, 37.832429207817725],
[-122.49163627624512, 37.832564787218985],
[-122.49223709106445, 37.83337825839438],
[-122.49378204345702, 37.83368330777276]
]
}
}- GeoJSON Full
- Combination of GeoJSON sources – displays all; example:
{
"id": "points",
"type": "symbol",
"source": {
"type": "geojson",
"data": {
"type": "FeatureCollection",
"features": [{
"type": "Feature",
"geometry": {
"type": "Point",
"coordinates": [-77.03238901390978, 38.913188059745586]
},
"properties": {
"title": "Mapbox DC",
"icon": "monument"
}
}, {
"type": "Feature",
"geometry": {
"type": "Point",
"coordinates": [-122.414, 37.776]
},
"properties": {
"title": "Mapbox SF",
"icon": "harbor"
}
}]
}
},
"layout": {
"icon-image": "{icon}-15",
"text-field": "{title}",
"text-font": ["Open Sans Semibold", "Arial Unicode MS Bold"],
"text-offset": [0, 0.6],
"text-anchor": "top"
}
}
Style, Margins, Format
Style for common style settings