Integrating the KX Helm Charts with Prometheus
Metrics
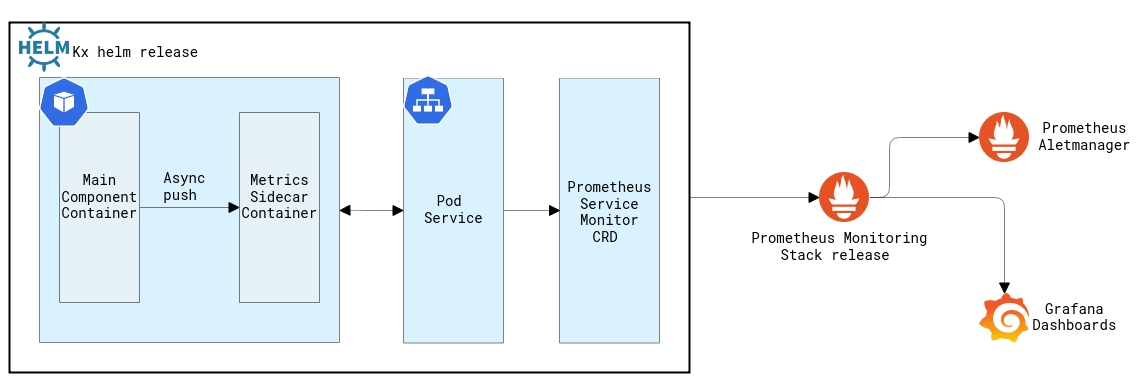
The charts support exporting application metrics via an HTTP endpoint, allowing scraping by monitoring systems, typically Prometheus. The charts use the KX Fusion Prometheus Exporter to do this.
Note
Enabling metrics requires deployment of the Prometheus Monitoring Stack
Configuring Prometheus is a cluster administrator task, and is a large topic. We have provided some background below.

Metrics are disabled by default. They can be enabled via the metrics.enabled boolean in the values.
To enable metrics globally via your values file.
global:
  metrics:
    enabled: true
Apply values files during installation
helm install insights kx-insights/insights -f example-values.yamlEnabling metrics will enable an additional sidecar container, to each of the component pods.
Notice your deployed component pods now have a second container (with a -sidecar suffix) running. You should now be able to open a shell to your component, and scrape its metrics port (TCP/8080 by default).
$ kubectl exec -it sts/insights-kxi-sp -- sh
Defaulting container name to kxi-sp.
Use 'kubectl describe pod/insights-kxi-sp-0 -n kx' to see all of the containers in this pod.
~ $
~ $ curl -s http://127.0.0.1:8080/metrics
# HELP kdb_info process information
# TYPE kdb_info gauge
kdb_info{release_date="2021.06.09", release_version="4", os_version="l64", process_cores="4", license_expiry_date="2022.03.05"} 1
# HELP memory_usage_bytes memory allocated
# TYPE memory_usage_bytes gauge
memory_usage_bytes 2359424
# HELP memory_heap_bytes memory available in the heap
# TYPE memory_heap_bytes gauge
memory_heap_bytes 6.710886e+07
# HELP memory_heap_peak_bytes maximum heap size so far
# TYPE memory_heap_peak_bytes gauge
memory_heap_peak_bytes 6.710886e+07
Metrics Scrape
Metrics are gathered locally and pulled by the metrics side-car.
Once metrics are in the side-car they can be scraped via a REST request to the side-car, or via a ServiceMonitor.
.z Event Handlers
Metrics are gathered from the component container by overriding the .z namespace event handlers.
You can toggle metrics for each of the handlers with the relevant metrics.handler.* key in your component values.yaml.
handler:
    po: true
    pc: true
    wo: true
    wc: true
    pg: true
    ps: true
    ws: true
    ph: true
    pp: true
Details on what metrics are created can be seen here
ServiceMonitor
The charts can be configured to render ServiceMonitor resources. ServiceMonitor is a Custom Resource Definition (CRD) provided by the Prometheus Operator.
ServiceMonitor resources can be enabled by using the metrics.serviceMonitor.enabled boolean in values.
The ServiceMonitor is disabled by default, and also requires metrics to be enabled.
You can enable the ServiceMonitor, for a given component from your values file:
example-values.yaml
global:
  metrics:
    enabled: true
  serviceMonitor:
    enabled: true
helm install insights kx-insights/insights -f example-values.yamlPrometheus
Prometheus is a very popular monitoring and alerting toolkit when it comes to monitoring Kubernetes. A common method of deploying the prometheus stack is using the Prometheus Operator.
This operator is then typically bundled together with other components, such as Grafana for visualizations, and node metrics exporters to gather cluster-wide metrics. One example of this is the kube-prometheus-stack helm chart, maintained by the Prometheus community.
Deploying the monitoring stack
We are going to install the monitoring stack into a newly created monitoring namespace, using helm.
The helm release is called kx-prom. This is important to note, as this is how a default monitoring configuration is integrated.
Create the target namespace
$ kubectl create ns monitoring
namespace/monitoring created
Configure the helm repo for the kube-prometheus-stack chart
helm repo add prometheus-community https://prometheus-community.github.io/helm-charts
helm repo add stable https://charts.helm.sh/stable
helm repo update
Monitoring Release Name
Note the release name below - kx-prom
This needs to match labels set within your ServiceMonitor
$ helm install kx-prom prometheus-community/kube-prometheus-stack -n monitoring
NAME: kx-prom
LAST DEPLOYED: Thu Dec  3 14:49:04 2020
NAMESPACE: monitoring
STATUS: deployed
REVISION: 1
NOTES:
kube-prometheus-stack has been installed. Check its status by running:
  kubectl --namespace monitoring get pods -l "release=kx-prom"

Visit https://github.com/prometheus-operator/kube-prometheus for instructions on how to create & configure Alertmanager and Prometheus instances using the Operator.
Wait a few moments, ensure that all your pods are up:
$ kubectl --namespace monitoring get pods -l "release=kx-prom"
NAME                                                 READY   STATUS    RESTARTS   AGE
kx-prom-kube-prometheus-stack-operator-7dd7865779-fz9dp   1/1     Running   0          71s
kx-prom-prometheus-node-exporter-4txm7                    1/1     Running   0          71s
Check we can hit the Prometheus UI.
$ kubectl port-forward -n monitoring svc/kx-prom-kube-prometheus-stack-prometheus 9090:9090
Forwarding from 127.0.0.1:9090 -> 9090
Forwarding from [::1]:9090 -> 9090
and connect to http://127.0.0.1:9090.
Check we can access the Grafana UI
Default credentials
Username: admin
Password: prom-operator
$ kubectl port-forward -n monitoring svc/kx-prom-grafana 8080:80
Forwarding from 127.0.0.1:8080 -> 3000
Forwarding from [::1]:8080 -> 3000and connect to http://127.0.0.1:8080
Finally, as we are using the operator, we can inspect our custom resource, called prometheus by default. We can run kubectl describe on this resource, which will describe the prometheus installation.
Take note of the section called "Service Monitor Selector" and the configured label selector.
$ kubectl describe -n monitoring prometheus
[... SNIP ...]
Spec:
  Alerting:
    Alertmanagers:
      API Version:   v2
      Name:          kx-prom-kube-prometheus-stack-alertmanager
      Namespace:     monitoring
      Path Prefix:   /
      Port:          web
  Enable Admin API:  false
  External URL:      http://kx-prom-kube-prometheus-stack-prometheus.monitoring:9090
  Image:             quay.io/prometheus/prometheus:v2.22.1
  Listen Local:      false
  Log Format:        logfmt
  Log Level:         info
  Paused:            false
  Pod Monitor Namespace Selector:
  Pod Monitor Selector:
    Match Labels:
      Release:  kx-prom
  Port Name:    web
  Probe Namespace Selector:
  Probe Selector:
    Match Labels:
      Release:   kx-prom
  Replicas:      1
  Retention:     10d
  Route Prefix:  /
  Rule Namespace Selector:
  Rule Selector:
    Match Labels:
      App:      kube-prometheus-stack
      Release:  kx-prom
  Security Context:
    Fs Group:            2000
    Run As Group:        2000
    Run As Non Root:     true
    Run As User:         1000
  Service Account Name:  kx-prom-kube-prometheus-stack-prometheus
  Service Monitor Namespace Selector:
  Service Monitor Selector:
    Match Labels:
      Release:  kx-prom
  Version:      v2.22.1
Events:         <none>
Deploy KX Helm Charts
To enable metrics, we:
- enable the sidecar exporter
- enable the ServiceMonitor resource
- configure the labels correctly, so as our monitoring system will know to process our ServiceMonitor resource
We will configure these settings via a values file.
Here is a snippet from the values:
global:
  image:
    repository: registry.dl.kx.com/
  metrics:
    enabled: true
    serviceMonitor:
      enabled: true
      additionalLabels:
        release: kx-prom
Note here that metrics and metrics.serviceMonitor are both enabled.
We also include custom labels, specifically release: kx-prom. This allows the ServiceMonitor to be handled by the Prometheus operator installed.
Deploy the chart:
$ cd charts/insights
$ helm install --dependency-update insights . \
  -f example-values.yaml
Hang tight while we grab the latest from your chart repositories...
...
Check your pods are up:
$ kubectl get pods
NAME                                             READY   STATUS    RESTARTS   AGE
disco-discovery-proxy-854b6fc8b8-74xf4           2/2     Running   0          24d
disco-discovery-proxy-854b6fc8b8-dcn4p           2/2     Running   0          24d
disco-discovery-proxy-854b6fc8b8-nxtwv           2/2     Running   1          13d
insights-aggregator-6d6946bb55-7k6lk             2/2     Running   0          18m
insights-aggregator-6d6946bb55-c22k8             2/2     Running   0          18m
insights-aggregator-6d6946bb55-hzm9p             2/2     Running   0          18m
insights-api-gateway-58d66f5d8d-ndzn5            1/1     Running   2          18m
insights-client-controller-6c6cf849d-fhzkw       2/2     Running   0          18m
insights-client-controller-6c6cf849d-jg944       2/2     Running   0          18m
insights-client-controller-6c6cf849d-r7tlb       2/2     Running   0          18m
...
Check the ServiceMonitors have been created:
$ kubectl get servicemonitors
NAME                                       AGE
insights-aggregator                        19m
insights-client-controller                 19m
insights-discovery-proxy                   19m
insights-information-service               19m
insights-kxi-sp                            19m
insights-resource-coordinator              19m
Using the metrics
Open your session to the prometheus UI:
$ kubectl port-forward -n monitoring svc/kx-prom-kube-prometheus-stack-prometheus 9090:9090
Forwarding from 127.0.0.1:9090 -> 9090
Forwarding from [::1]:9090 -> 9090
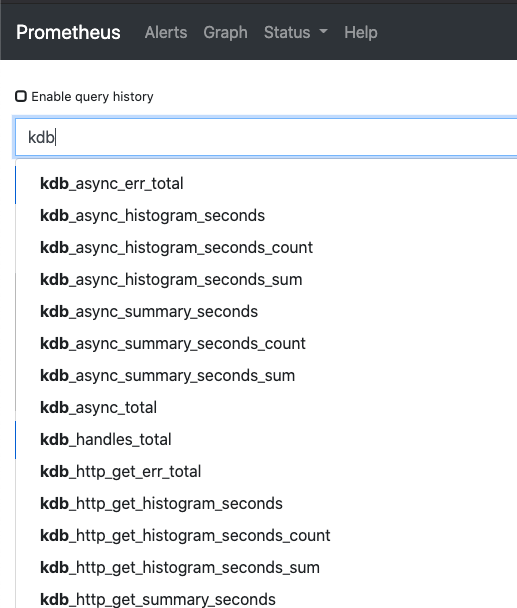
Connect to http://127.0.0.1:9090 and confirm metrics are available, by typing kdb into the query box:

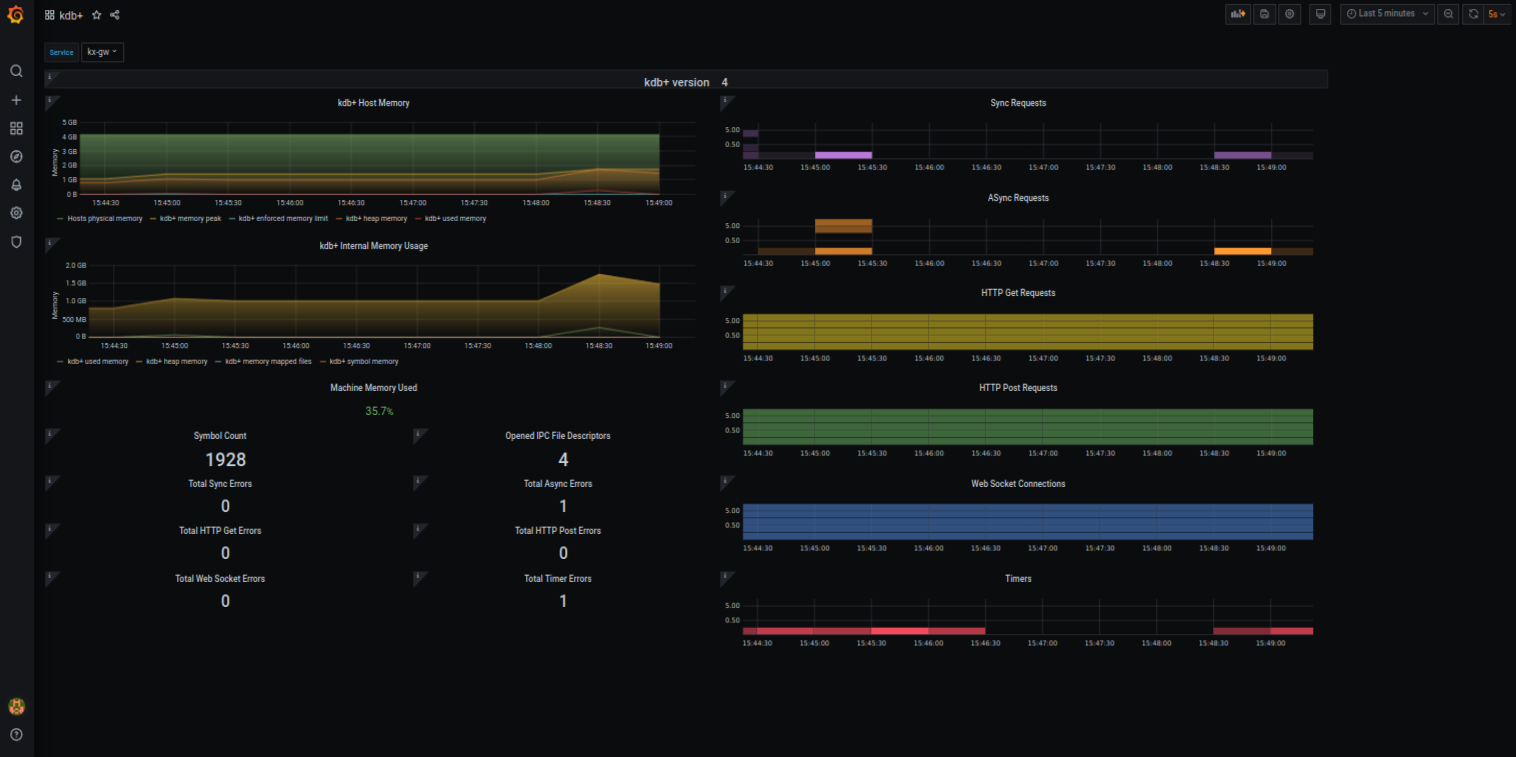
Your metrics should now be available to be visualized by Grafana.
Grafana Dashboard
Below is an example dashboard using the captured container metrics.

This a modified version of the dashboard available with KX Fusion Prometheus Exporter.
Prometheus Metrics
Prometheus has four metric types, brief detail below
Counter
A basic metric, allows incremental values to be recorded. Counter metrics can only increase in value, for metrics where values may increase or decrease a gauge should be used.
Counter metrics may be used to calculate the rate of an event when queried, by using Prometheus Functions such as rate.
rate(kdb_async_total{}[30s])Example uses: - Requests made to service - Error events - Message throughput
See Prometheus Counter documentation.
Gauge
Similar to the counter metric, but the gauge metric is permitted to decrease in value as well as increase.
Gauge metrics can be used to calculate averages.
avg_over_time(memory_usage_bytes[5m])Example uses: - Component memory resource usage - Queued tasks or requests - Open connections or handles to the component
See Prometheus Gauge documentation.
Histograms
Histogram metrics are configured with specific predefined "less than or equal to" buckets, metrics then capture the frequency of which values fall into those buckets.
Instead of capturing each individual value, Prometheus will store the frequency of requests that fall into a particular "less than or equal to" bucket.
Histograms may be used to calculate averages or percentile values.
histogram_quantile(0.9, rate(kdb_sync_histogram_seconds{service="kx-tp"}[10s]) )Examples uses: - Requests completion times - Request response sizes
See Prometheus Histogram documentation.
Summary
Summaries are similar to Histograms, where histogram quantiles are calculated on the Prometheus server, summaries are calculated on the application server.
See Prometheus Summary documentation.
Metric Type Overview
| Counter | Gauge | Histogram | Summary | |
|---|---|---|---|---|
| Can go up and down | False | True | True | True |
| Is a complex type (publishes multiple values per metric) | False | False | True | True |
| Is an approximation | False | False | True | True |
| Can query with rate function | True | False | False | False |
| Can calculate percentiles | False | False | True | True |
| Can query with histogram_quantile function | False | False | True | False |