Map
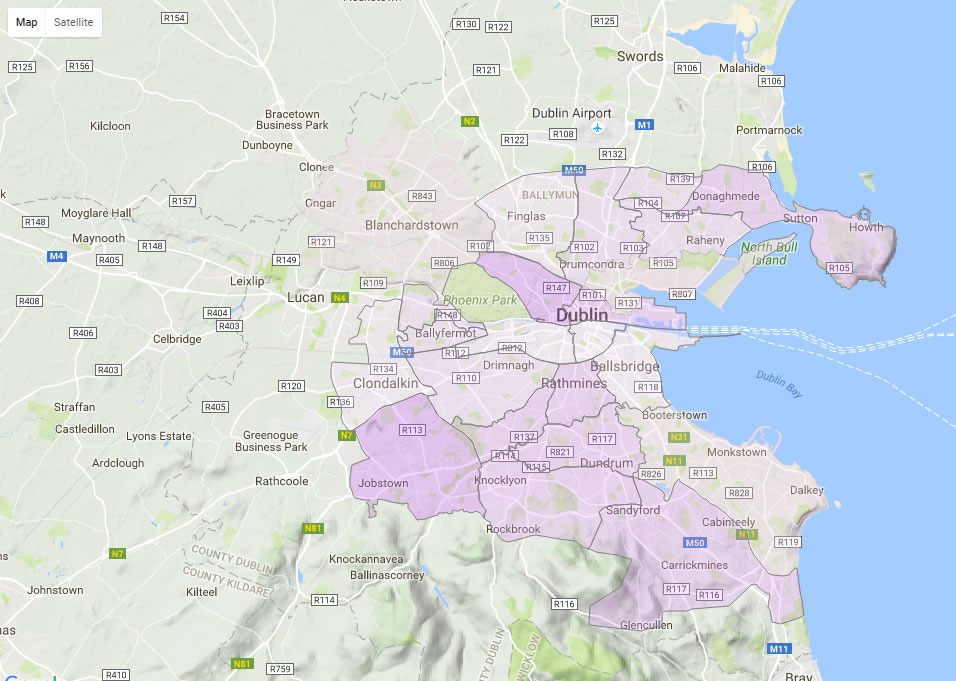
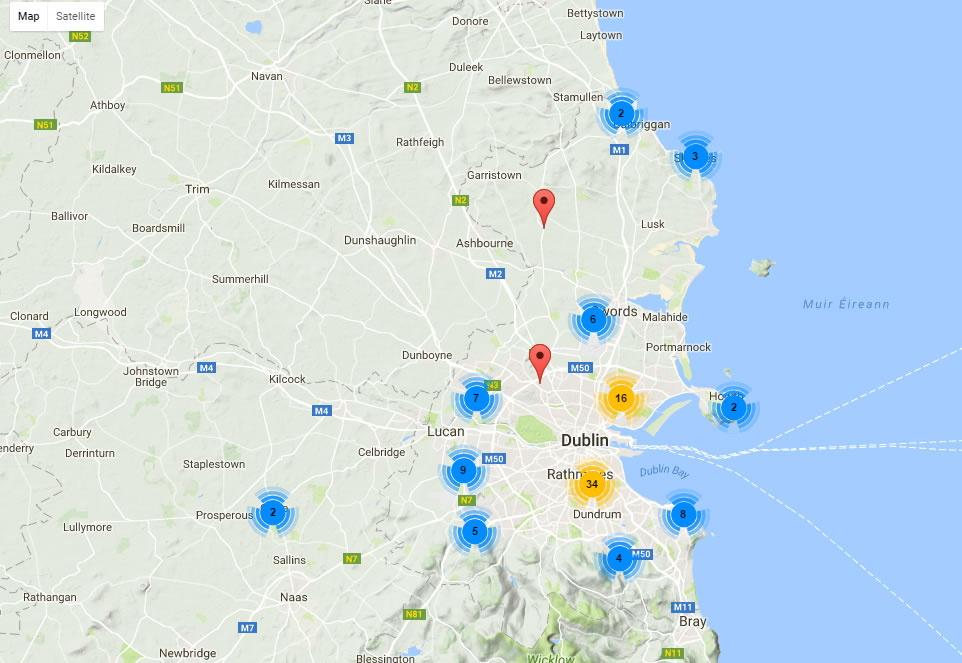
A Map with a Statistical Overlay
Displays geographical data. Unlike other components, different data sources can be assigned and overlaid by map type.
Set up
-
Select the map type to use.
-
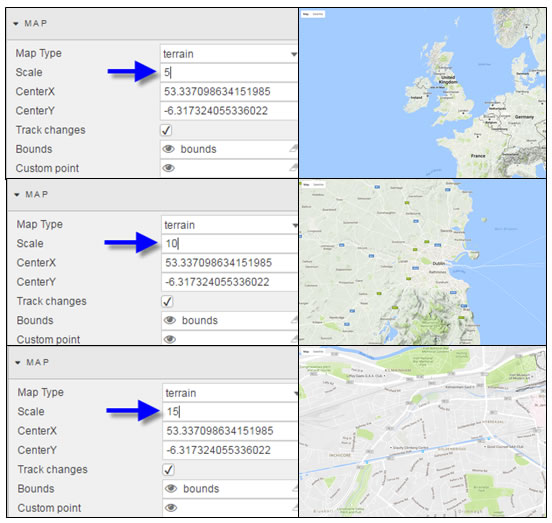
Define the bounds for the viewable area of the map using a view state parameter; centered by CenterX and CenterY, at a defined zoom scale on load.
-
Irrespective of the map selection, ensure the data source has a longitude and latitude reference for mapped elements.
Basics
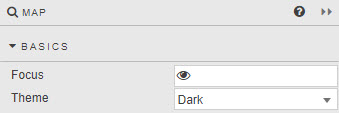
- Focus
- A View State Parameter used for linking components
- Theme
- Light or Dark
Map
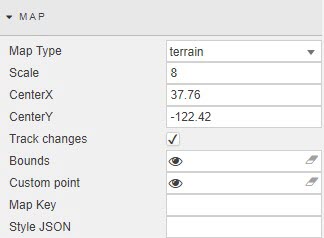
- Map Type
-
Select from
terrain,satellite,roadmaporhybrid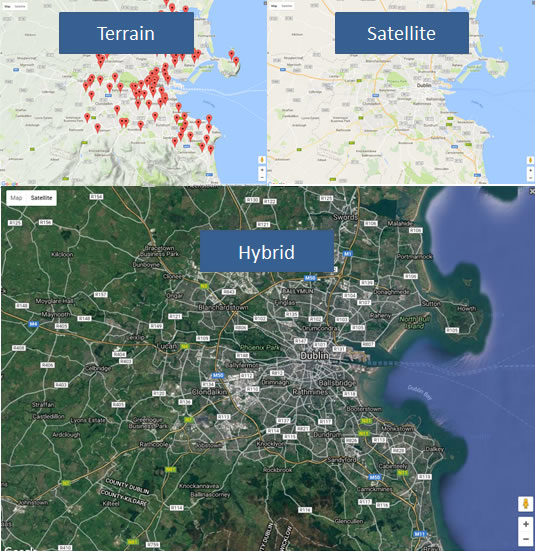
- Scale
-
Zoom level
- Center X/Y
- Sets map center on dashboard load; define longitude and latitude values.
- Track Changes
-
When checked, will update co-ordinates after user interaction.
Saved state
Map will open on updated Center X/Y co-ordinates on next dashboard load.
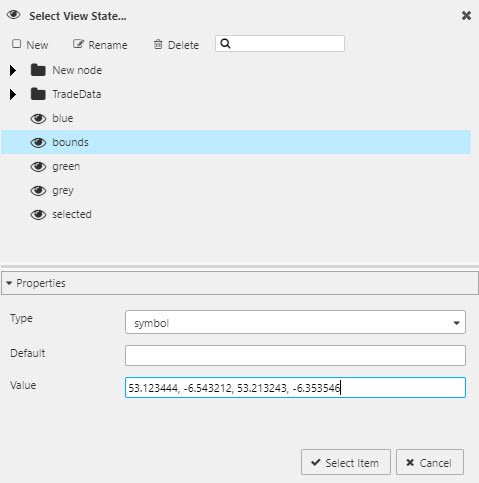
- Bounds
-
A View State Parameter which stores the co-ordinates for the viewable area of the map
- Custom point
-
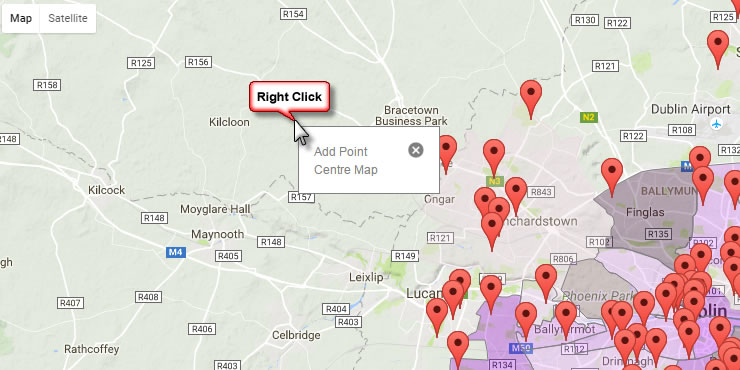
When a View State Parameter is set, right-clicking on the map allows the user to create a custom point: its co-ordinates will be held in the View State Parameter.
Warning
Without a View State Parameter set, right-clicking on the map will not add a custom point.
- Map Key
- Allows the user to load the map with their Google map ID.
- StyleJSON
-
Apply JSON style from Mapstyle.withgoogle.com.
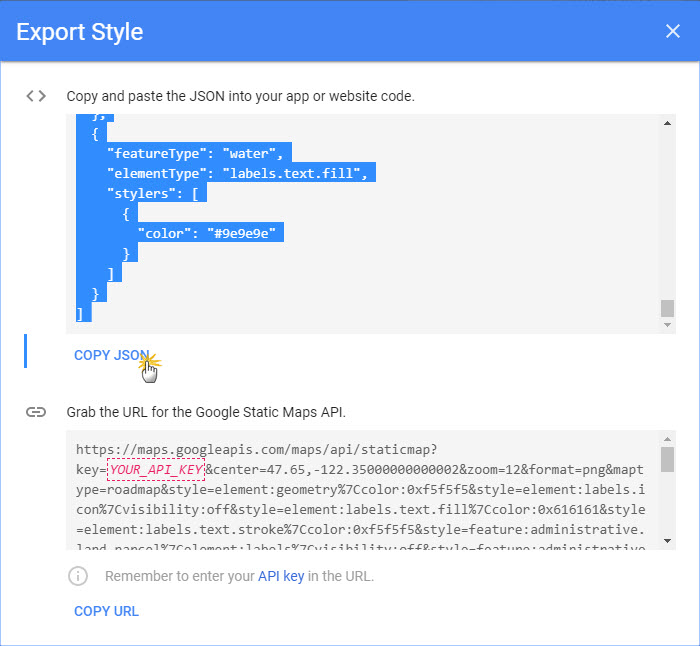
Cut-and-paste the JSON into the Style property. A view state parameter of type String can also be used to store the JSON.
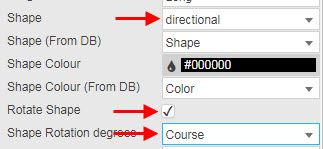
Points
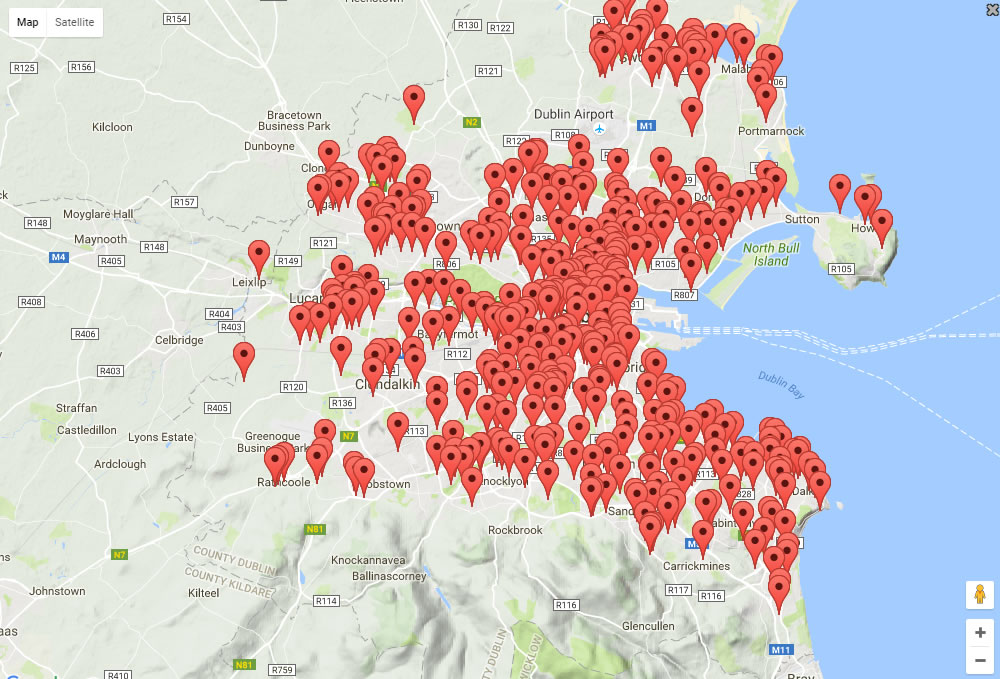
Map displaying data points
Plots distinct data points on map
- Data Source
- A data source that includes geographic coordinates
- Selected Value
- Selected values
- Tracker
- A View State Parameter for TrackedItem
- TrackedItem
-
A Data Source column for the Tracker View State Parameter, set when the user selects a point on the map
More mapped items
Additional mapped items can be tracked using Selected Point Viewstate Routing
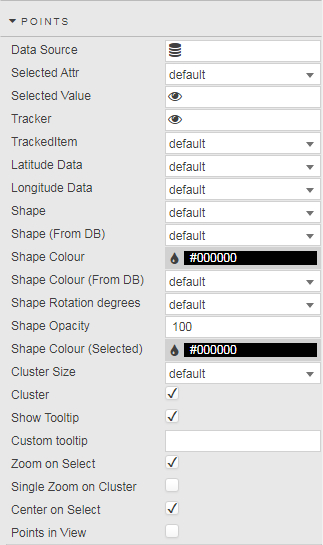
- Latitude / Longitude Data
-
Data Source columns for latitude and longitude
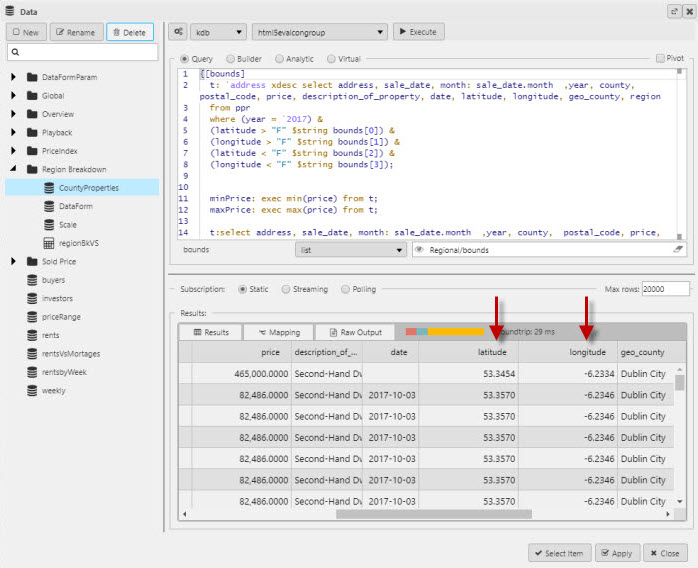
Latitude and longitude columns in the Data Source - Shape
- Rotate Shape
- Shape Rotation Degrees
-
The shape of the map point graphic: dot, pointer, etc.
-
directionaluses pointer icons, the direction of the point is determined by Shape Rotation Degrees (a Data Source column) when enabled by Rotate Shape.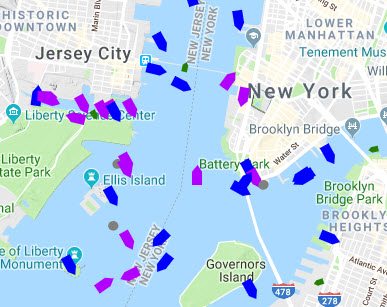
- Shape (From DB)
- A Data Source column: the shape of the map point graphic (alternative to Shape)
- Shape color
- Color of the map point graphic
- Shape color (From DB)
- A Data Source column: color of the map point graphic (alternative to Shape Color)
- Shape Opacity
- Opacity of the map point graphic
- Cluster Size
-
Size of clusters into which points are aggregated; select from values in increments of ten to
70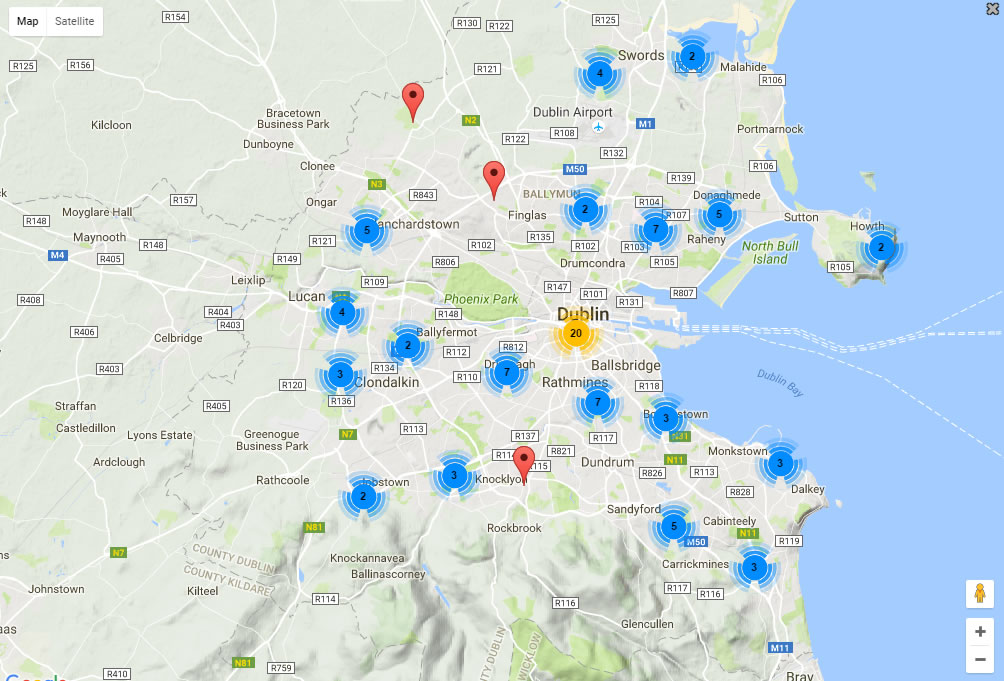 Map clusters
 - Cluster
- When checked, replaces grouped individual points with a numeric cluster icon. Points outside cluster remain displayed as individual points.
- Show Tooltip
- When checked, displays a tooltip on Point rollover
- Custom Tooltip
-
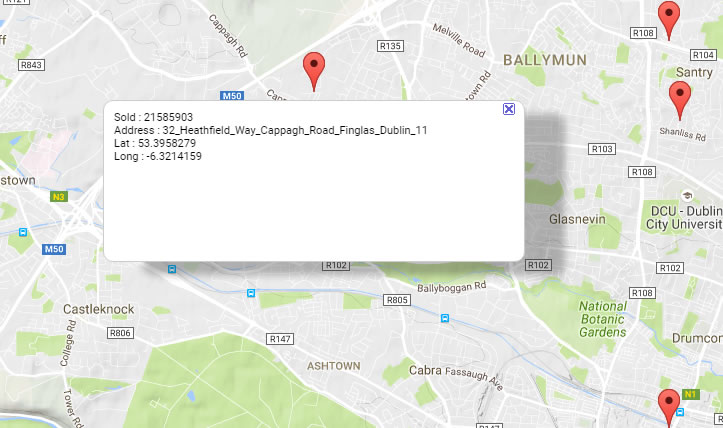
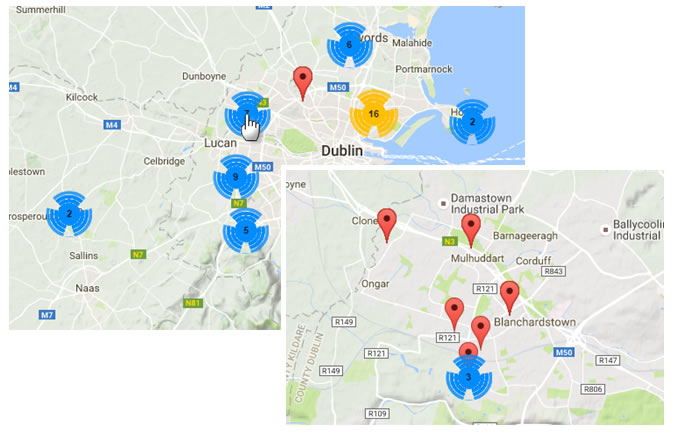
Custom tooltip on a Map - Zoom on Select
- When checked, map will zoom when user selects a point
- Single Zoom on Cluster
-
When checked, map will zoom on selected cluster
- Open Dashboard on Select
- A dashboard: when user selects a map point, the dashboard will load
- Points in View
-
When checked, map will auto-zoom to show all available data points
Action
Circles
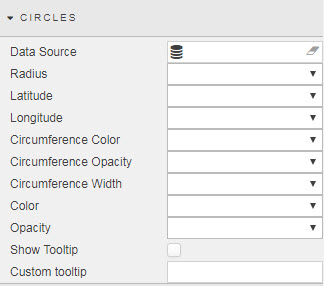
- Data Source
- A data source that includes geographic coordinates.
- Radius
- Data source column with radius of circle
- Latitude / Longitude
- Data Source columns with geographic co-ordinates
- Circumference Color, Opacity and Width
- Data Source columns with details on color (hex reference), opacity and width (pixels)
- Color
- Circle color
- Opacity
- Opacity of circle
- Show Tooltip
- Enable Tooltip
- Custom Tooltip
Lines
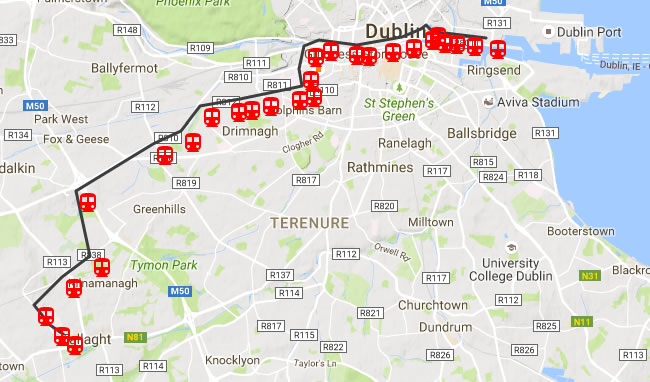
A line on a Map
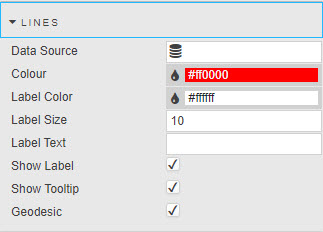
Map Lines configuration
- Data Source
- A data source that includes geographic coordinates
- Latitude / Longitude Data
- Data Source columns with geographic co-ordinates
- color
- Color of the line
- Label Color
- Background color of rollover label
- Label Size
- Size of the label
- Label Text
- Can also be a View State Parameter
- Show Label
- When checked, displays the label
- Show Tooltip
- When checked, displays the tooltip
- Geodesic
- When enabled, draws a (curved) line connecting the shortest possible distance between two points on a sphere.
Lines query example
Stop         long      lat      Line
------------------------------------
Tallaght     -6.374589 53.28749 Red
Hospital     -6.37885  53.28937 Red
Cookstown    -6.384397 53.29351 Red
Belgard      -6.374886 53.29929 Red
Kingswood    -6.36525  53.30369 Red
Red_Cow      -6.369872 53.31683 Red
Kylemore     -6.343444 53.32666 Red
Bluebell     -6.333792 53.3293  Red
Blackhorse   -6.327394 53.33426 Red
Drimnagh     -6.318161 53.33536 Red
Goldenbridge -6.313569 53.33589 Red
Suir_Road    -6.307211 53.33662 Red
Rialto       -6.297242 53.33791 Red
Fatima       -6.292547 53.33844 Red
Jamess       -6.293361 53.34194 Red
Heuston      -6.291808 53.34665 Red
Museum       -6.286714 53.34787 Red
Smithfield   -6.277728 53.34713 Red
Four_Courts  -6.273436 53.34686 Red
Jervis       -6.265333 53.34769 Red
..linesexample.csv: the above table as a CSV
linesexample.q: a datasource query on the above table as a function of the Line, e.g. Red or Green
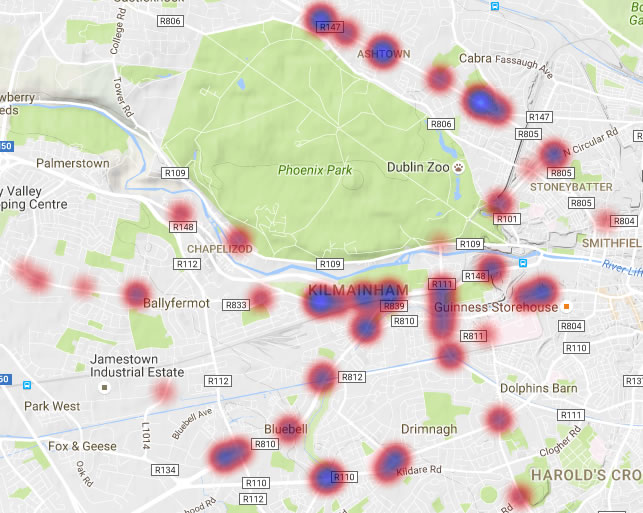
Heat Map
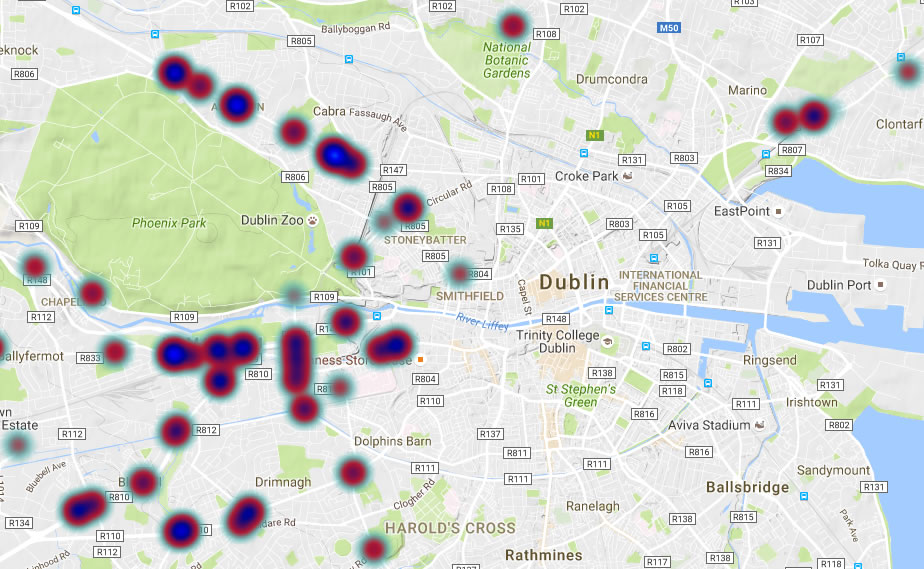
A traffic heat map
Dynamic overlays
Can be used for dynamic overlays; e.g. when linked with a Playback component.
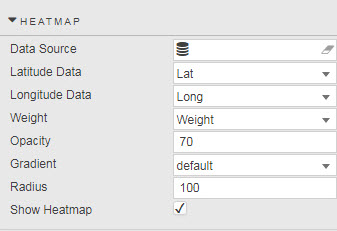
- Data Source
- A data source that includes geographic coordinates
- Latitude / Longitude Data
- Data Source columns with geographic co-ordinates
- Weight
- A Data Source column with the heat-map weights
- Opacity
-
Opacity of the overlay
- Gradient
- Color gradient: red-bllue, blue-red, etc
- Radius
- Radius for heat-map spread
- Show Heatmap
- When checked, the overlay is visible
Overlay
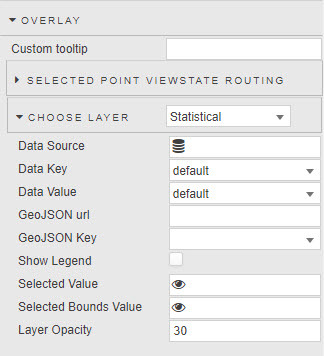
- Custom Tooltip
- Custom tooltips
- Selected Point Viewstate Routing
- Selected values
- Choose Layer
- Select from dropdown; single option `Statistical``
- Data Source
- A data source that includes geographic coordinates and a column containing the color reference for overlay shading
- Data Key
- Column containing an index reference for the overlay data
- Data Value
- Overlay day mapped to Data Key
- GeoJSON
- Custom GEOJson url overlay and GeoJSON Key reference key
- Show Legend
- Display color code legend of overlay
- Selected Value
- Map selected overlay key to a View State Parameter
- Selected Bounds Value
- Map selected bounds coordinates of the overlay to a View State Parameter
- Layer Opacity
- Select overlay transparency; 0 for fully transparent, 100 for opaque.
Rectangle Bounds
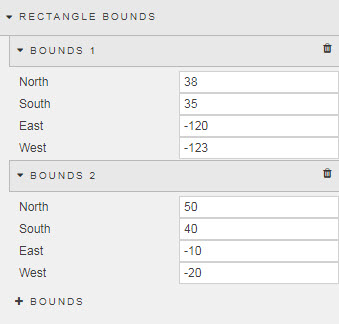
A user-defined zone (defined within bounds) by longitude and latitude co-ordinates. More than one user-set boundary can be set.
- North
- South
- East
- West
- longitudinal and latitudinal co-ordinates for user-defined boundary.
Style, Margins, Format
Style for common style settings