Visual Profiler
The Visual Profiler allows the user to profile function calls. This tool works similar to the visual inspector, as several charts are provided for visualizing the data:
- Flamegraph
- Table
- Time Tree
- Space Tree
- TMC Tree
- Timeline
The profiler measures runtime and memory usage for the function calls in a given functions call stack. The Visual Profiler then uses the interface for the Visual Inspector to display those results.
Opening the profiler
Similar to the Visual Inspector, the profiler can be opened by picking Tools, then Visual Profiler from the main view in Analyst.
Opening on an expression
The Visual Profiler can also be invoked from Analyst by selecting any q expression that invokes a function and performing one of the following operations:
- Right-click and pick Profile from the context menu
- Press Meta+Alt+P on the keyboard as a shortcut
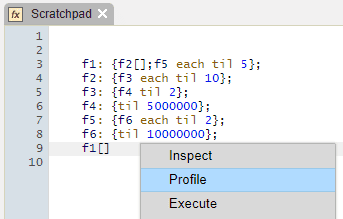
The Analyst IDE will then profile the q expression that had been selected, and will present a default Table view of the profiler result.
Entering queries into the profiler
Similar to the Visual Inspector, you can enter q queries directly into the query input line.
Sampling profiler (beta)
Available only on Linux, using kdb+ 4.0 or higher
The sampling profiler is the most performant profiler mode. It can generate flamegraphs or a table of time spent in each function. It does not support memory profiling.
The expression is profiled by sampling the callstack every 1ms, making the results probabilistic. Expressions that run very quickly may benefit from being run in a loop.
The query is run in a new Analyst process, so it will not have access to any state in the current Analyst process. State must be set up with the initialization parameter, which is q code to be run in the new process before the query is profiled. The new process runs in the current present working directory.
Flamegraphs
A flamegraph shows the callstack over the duration of the expression. A vertical slice represents the callstack at a given sample, and the width of a bar represents how long a function ran for. Functions are ordered alphabetically, not temporally, and multiple calls to a function with the same ancestors are shown as a single box. The colors are chosen at random.
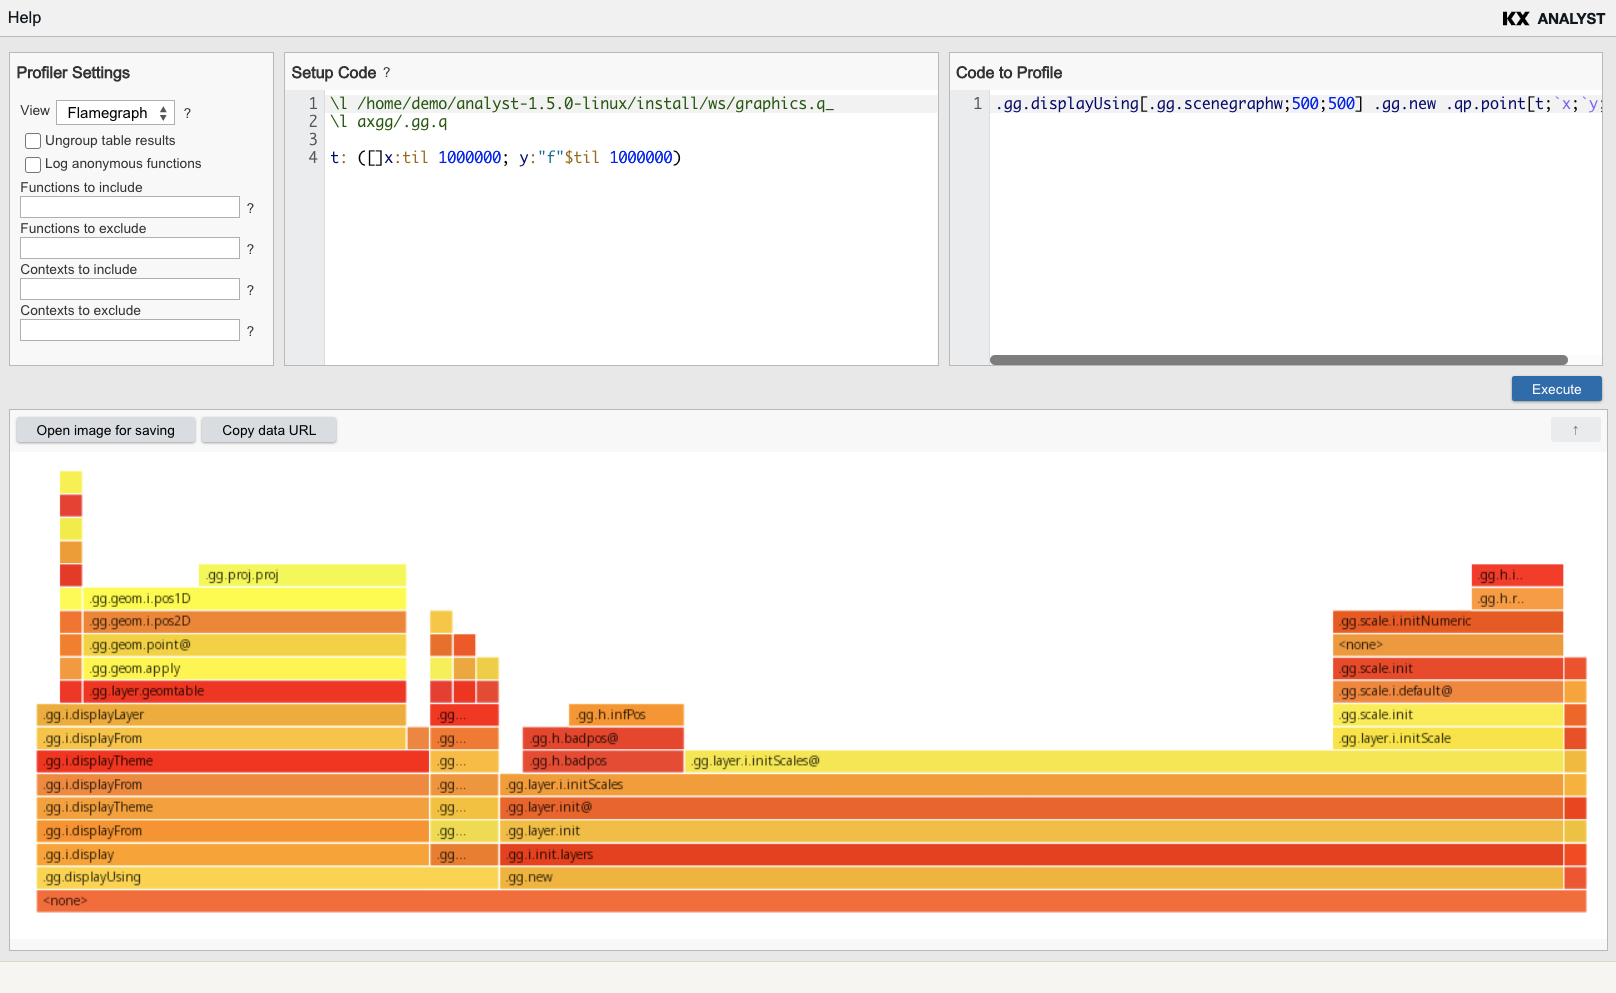
Flamegraphs can be generated programmatically with .profile.flamegraph.
.profile.sampling
This returns a table with the time spent executing the functions (totalPercent and totalRuntime), and the time subtracting child functions (percent and runtime).
q) init: "
  .test.tree1: {do[750;cos each til 1000; .test.tree2[] + .test.tree3[]]};
  .test.tree2: {cos each til 1000; .test.tree4[] + .test.leaf1[]};
  .test.tree3: {cos each til 1000; .test.leaf1[] + .test.leaf2[]};
  .test.tree4: {cos each til 1000; .test.leaf2[]};
  .test.leaf1: {cos each til 1000; 1};
  .test.leaf2: {cos each til 1000; 2}";
q) .profile.sampling[init; ".test.tree1[]"; "."]

name          file line col| percent runtime      totalPercent totalRuntime
---------------------------| ----------------------------------------------
".test.leaf1" ""   0    18 | 25.81   00:00:00.325 25.81        00:00:00.325
".test.leaf2" ""   0    18 | 25.42   00:00:00.320 25.42        00:00:00.320
".test.tree1" ""   0    18 | 12.79   00:00:00.161 100          00:00:01.259
".test.tree2" ""   0    18 | 12.39   00:00:00.156 50.28        00:00:00.633
".test.tree4" ""   0    18 | 11.91   00:00:00.150 24.94        00:00:00.314
".test.tree3" ""   0    18 | 11.68   00:00:00.147 36.93        00:00:00.465
""            ""   0    0  | 0       00:00:00.000 100          00:00:01.259
Comprehensive profiler
For chart types other than Flamegraph, the profiler will record all function calls, and capture both runtime and memory usage. It reports four metrics
Time- The runtime of the function calls as a timestamp.Space- The memory used the function calls in bytes.TMC- The runtime of each function call minus any time spent in the child functions as a timestamp. Thus, it reports the time spent exclusively in a given function.SMC- The memory used by each function call minus the memory used by the most memory intensive child function, in bytes. Given that memory may be reused by child functions, this measure reports the maximum possible memory that was used exclusively by the given function.
Profiler settings
There are five settings for controlling the behavior of the comprehensive profiler.
| settings | description |
|---|---|
| Log Anonymous Functions | It is possible to profile lambda functions within another function using this setting. |
| Include Functions | The profiler attempts to automatically find all the functions in a call stack. This will include any that may be missed. |
| Include Contexts | This will include all functions in any contexts that may be missed by the profiler. |
| Ignore Functions | This will ignore any functions that the user does not want to profile. |
| Ignore Contexts | This will ignore all functions in any contexts that the user does not want to profile. |
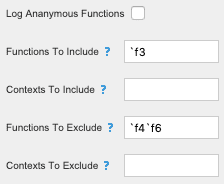
For the Include Functions, Include Contexts, Ignore Functions, and Ignore Contexts settings, each function name should be typed into the input
as a q symbol, separated by `. For example, `.foo.bar`.baz.quux.
In the below image, f3 is marked as a function to include while profiling, while f4 and f6 are marked as functions to ignore. Note that f3 does not need to be in the Include Functions list as it will be automatically found by the profiler. See the Profiler Function Reference for more details.
To use the updated settings the expression must be re-executed. Do to so, click on the expression in the query input line and click Enter.
Chart types
Five chart types are available using the comprehensive profiler. Each available chart is outlined here along with a description of the attributes associated with each.
See the Visual Inspector for more details about viewing and accessing plots.
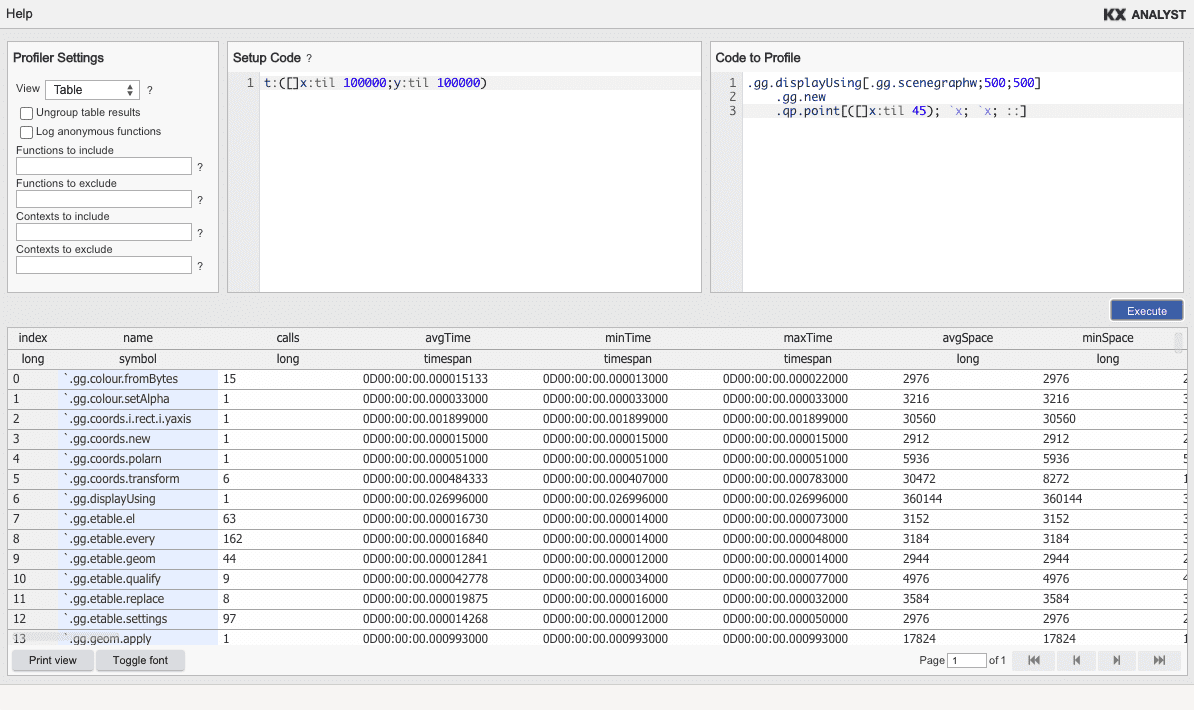
Table
This table works the same as the table chart for the Visual Inspector. It displays the following columns | Profiler measurement | columns | |----------------------|----------------------------------------| | Time | totalTime, avgTime, maxTime, minTime | | Space | avgSpace, maxSpace, minSpace | | TMC | totalTMC, avgTMC, maxTMC, minTMC | | SMC | avgSMC, maxSMC, minSMC |
As can be seen, the runtime measurements (Time and TMC) report the total, average, max, and minimum run times for the function calls, while the memory measurements (Space and SMC) only report the average, max, and minimum memory consumption.
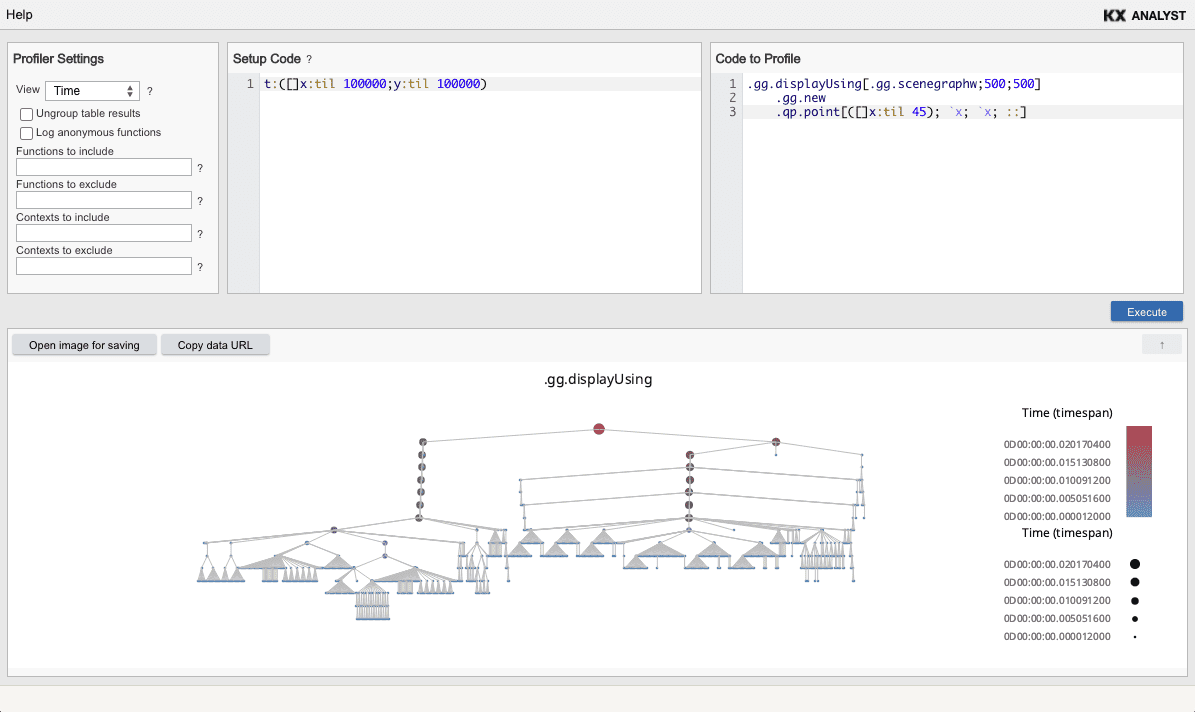
Time Tree
The Time Tree shows the call tree for the function, reporting the runtime of each function call as the colour and size of each node.
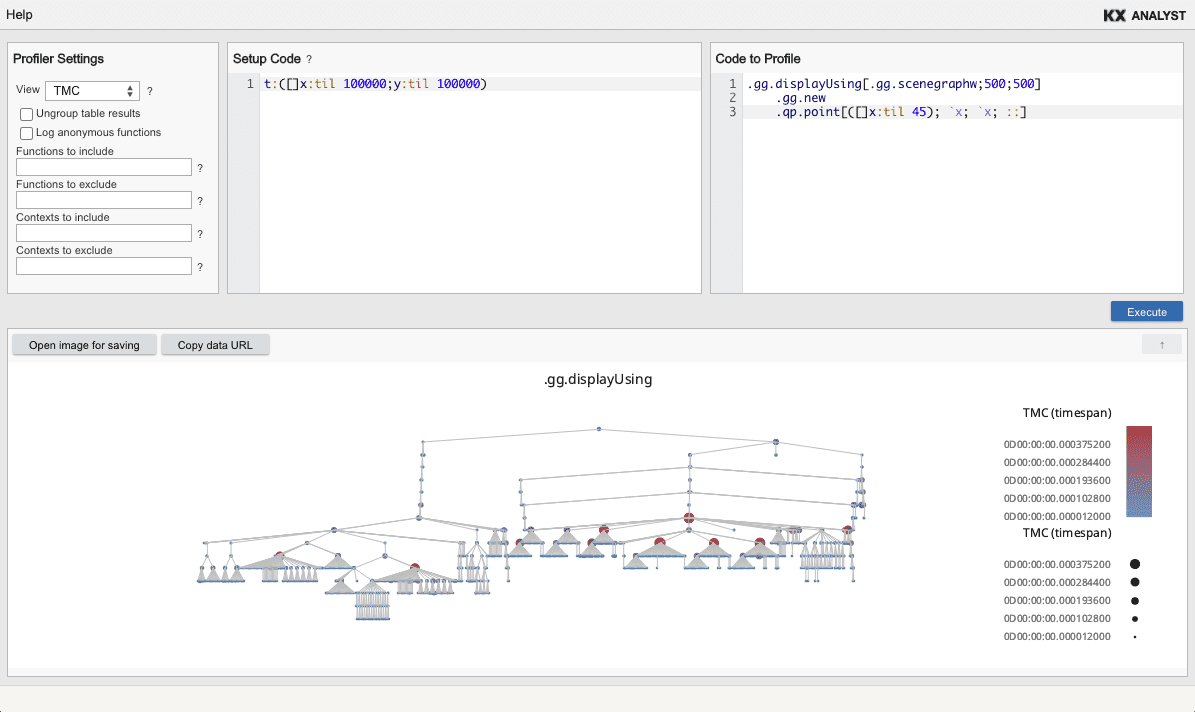
TMC Tree
The TMC Tree shows the call tree for the function, reporting the TMC of each function call as the colour and size of each node.
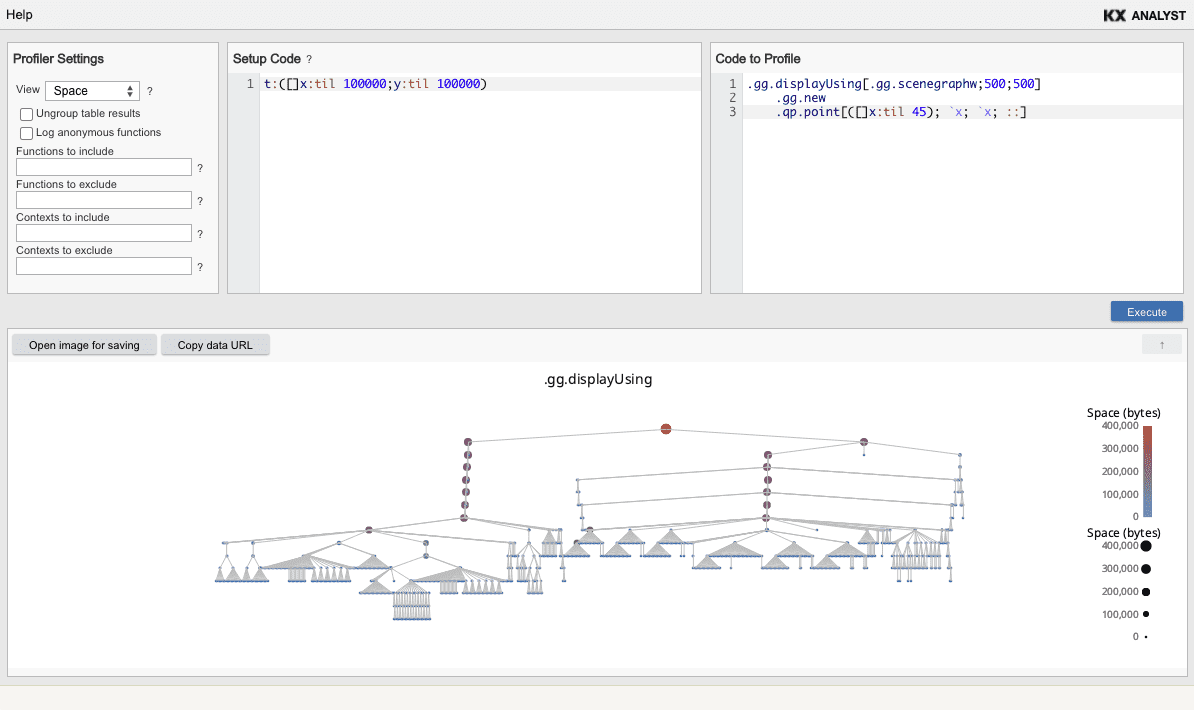
Space Tree
The Space Tree shows the call tree for the function, reporting the memory used by each function call as the colour and size of each node.
Timeline
The Timeline shows a timeline of each function call, with boxes weighted by the memory used for each function.
