Data analysis overview
Analyst is designed to support a wide range of users from non-technical analysts to experienced q programmers.
- Non-technical analysts can use an intuitive point-and-click interface to import, transform, filter, and visualize massive datasets without programming.
- Moderately skilled users, who are comfortable with a small amount of scripting, can use the Spreadsheet to perform simple or complex analytical computations on massive datasets in real-time.
- Experienced q programmers can use the complete development suite to write, execute, test, debug, and compare code resources such as scripts, functions and modules.
- All users can manage and share their code and data assets using the Analyst’s local and shared repositories and workspaces.
Transformer
The Transformer is a powerful extract, transform and load (ETL) tool that allows the analyst to perform complex data grooming operations on large datasets using a point-and-click interface. The analyst constructs their transformation using a sample of the dataset and then applies the transform against the entire dataset. With the Transformer, users can:
- Import and export a variety of formats (e.g. CSV, JSON, KDB, ODBC, etc.)
- Update column data
- Filter column data using simple or complex AND/OR combinations
- Add columns
- Change column types
- Perform various data operations (e.g. fill up, fill down, changing cases, replacing values)
- Perform various table join operations (e.g. left, union, append, etc.)
- Execute native (e.g. sum, average, standard deviation) or custom functions
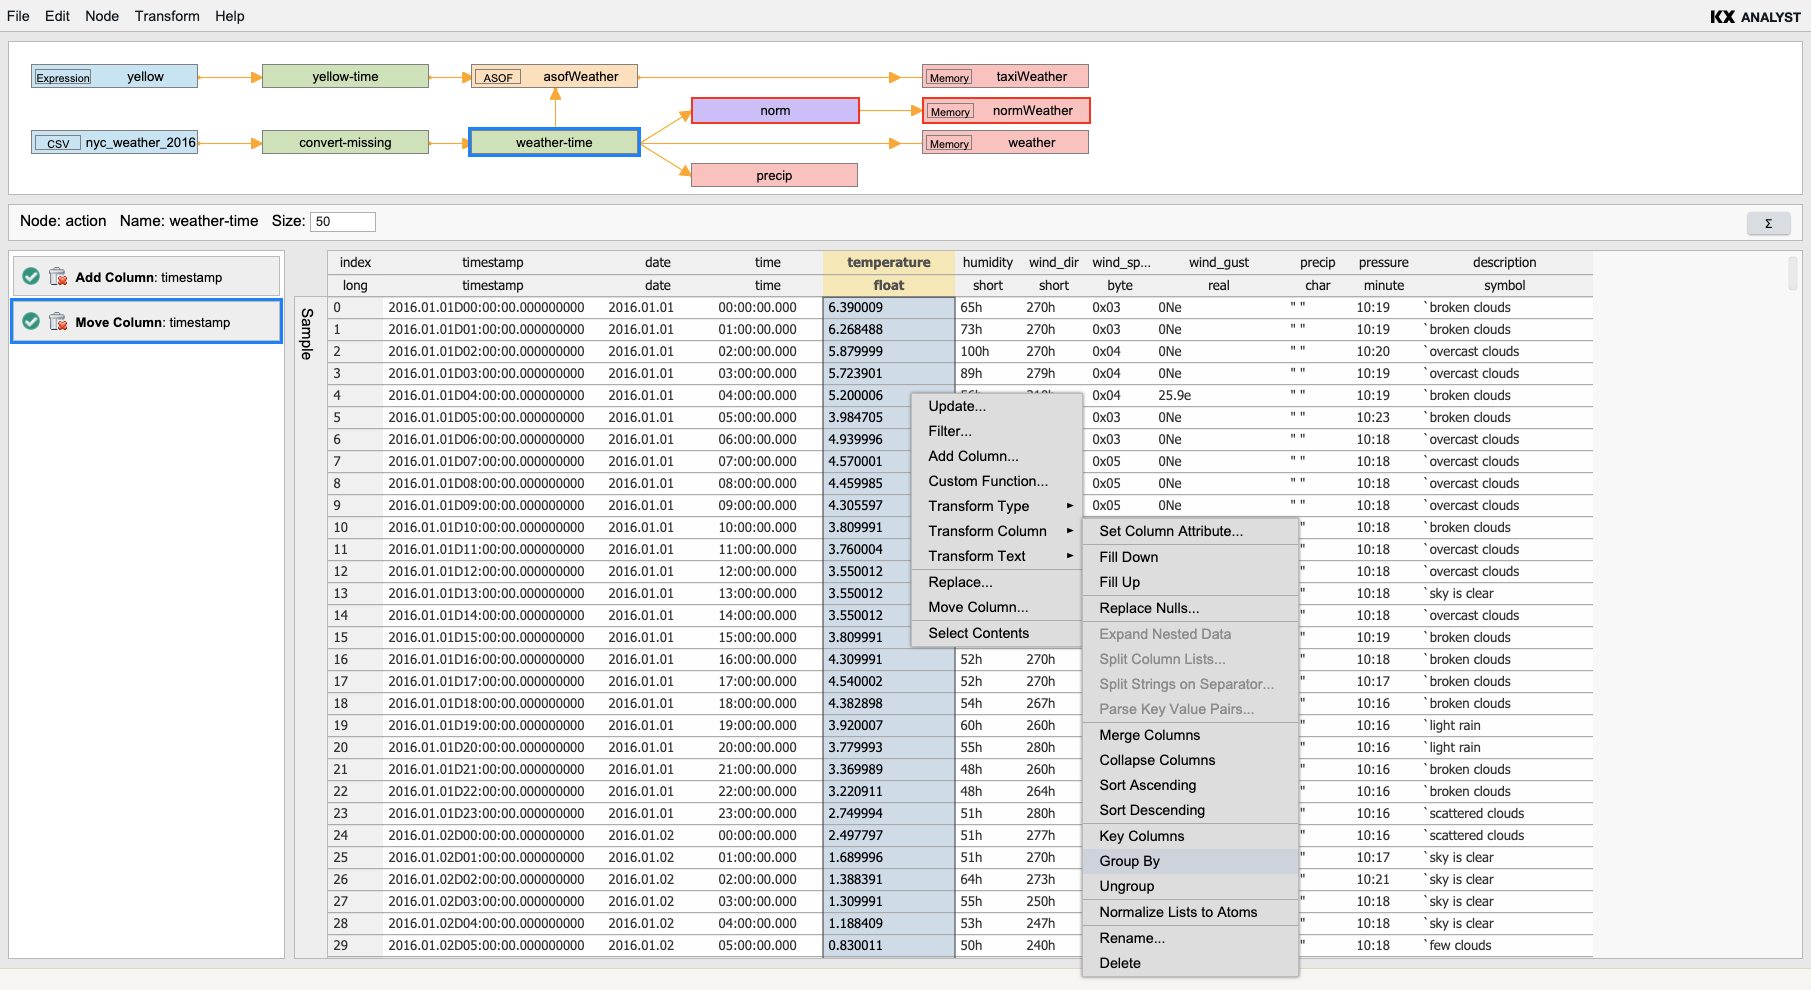
In the example below, the user has loaded two tables into the transformer, created a new table by performing a left join on the two tables, and modified the join output by changing the types of two of the columns from short integers to long integers. The top pane provides the user with a visual map of the transformation. The lower left pane provides the user with a list of actions that have been applied to the currently selected table. The lower right pane provides the user with a sample of the updated output so that they can verify that the actions have been applied correctly.
Spreadsheet
More sophisticated users can use the Spreadsheet to perform simple or complex data analysis. The sheet is similar to Excel, with many of the same features, but it allows users to load massive datasets without performance limitations.
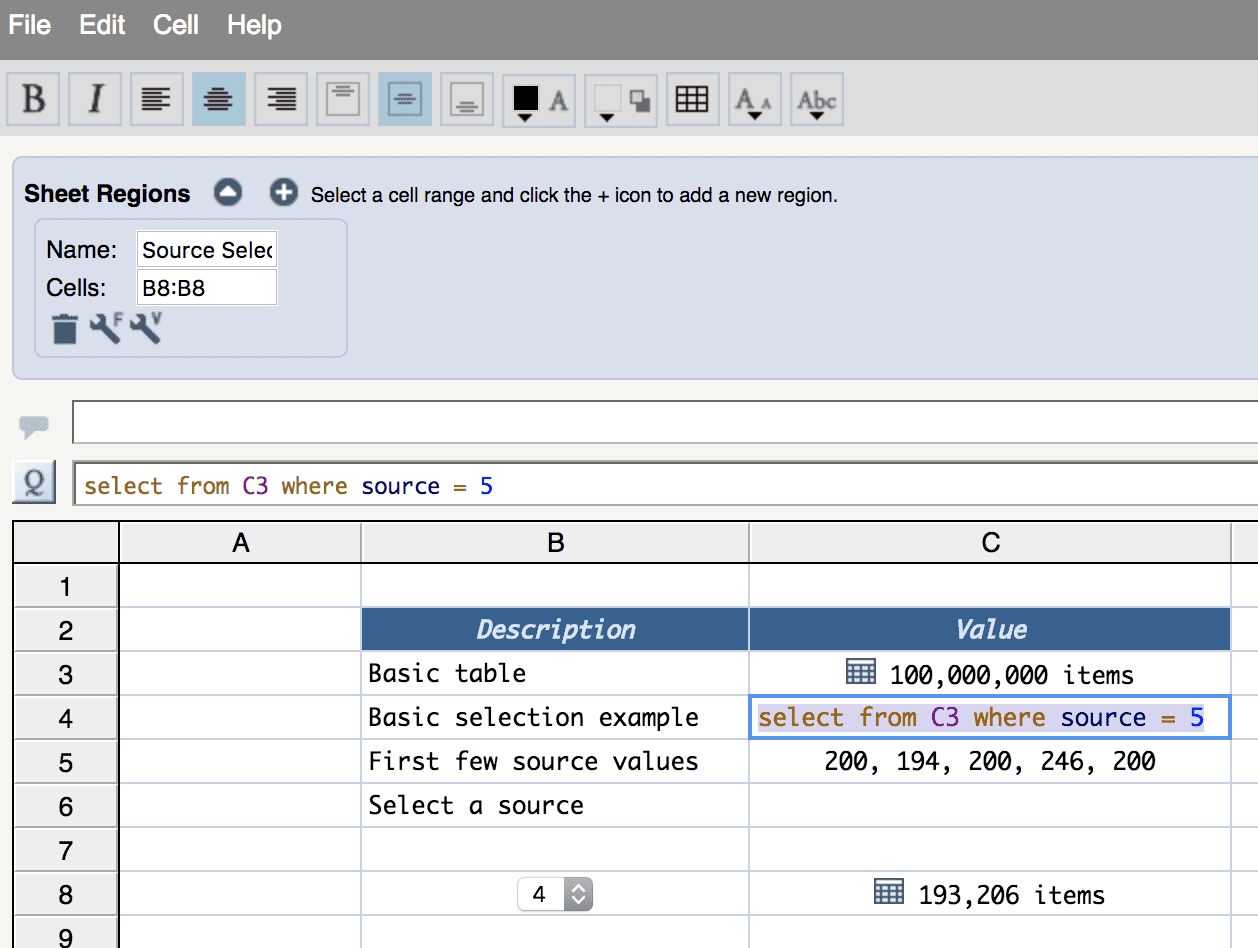
In the example below, a table containing 100 million records is loaded into the sheet. The user then performs standard SQL query operations in real-time against the dataset. In cell C5, the user is performing a simple filtering query against the table in cell B4. Queries similar to this example execute within seconds providing users with a seamless interactive experience. Users can also explore data on the Spreadsheet with the Visual Inspector.
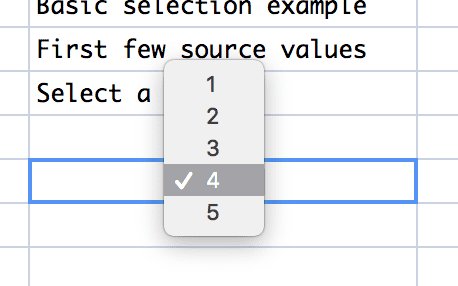
For development teams, the Spreadsheet can be programmed to create front-end user interfaces for novice users. In this example, a combo box has been added to a sheet using JavaScript. In this way, more sophisticated users can turn complex operations into simple point-and-click interfaces using a small set of helper functions.