Development overview
Workspace
The workspace lets the analyst store, version-control, and share their analysis with others. In the example below, we can see the workspace with a tree structure of artifacts on the left and a work area on the right. The tree shows the analyst’s local repository containing a project with two CSV files. The analyst can also look at the shared repository to see the public artifacts in the system and can publish artifacts to the shared repository.
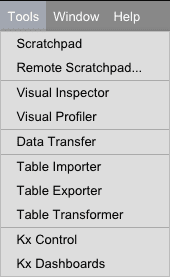
From the Tools menu, the user can access the Importer, Transformer, Exporter and Visual Inspector.
Importer
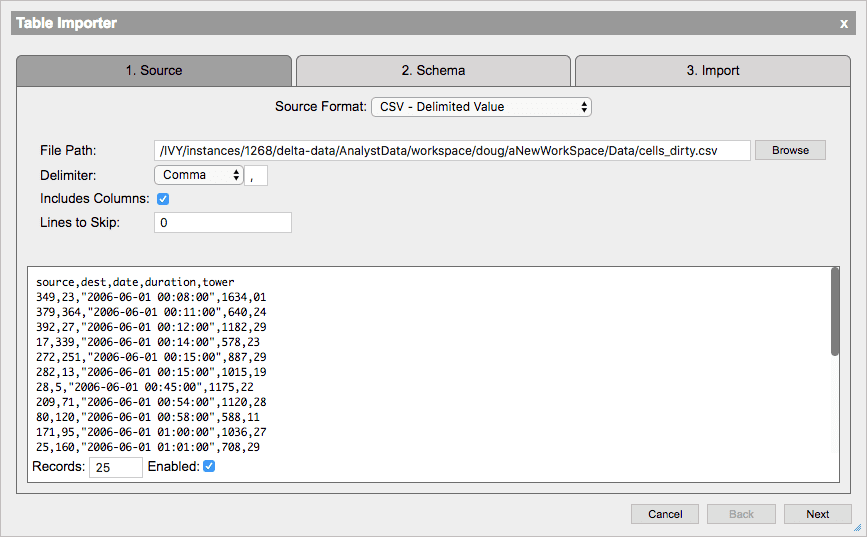
The Importer allows the analyst to import CSV, JSON, ODBC and kdb+ tables into their workspace using a wizard-style interface. They can upload files from their local machine or select files from the remote server.
The screenshot below shows the second step in the Table Importer wizard, where the analyst can change column names and adjust column types if they does not like the automatic column name and type detection performed by the Importer. In addition, they can sanitize the column names to trim blanks and remove keywords. When finished, the analyst can immediately import the file into the workspace, into the Visualizer for exploration, or save the file to disk in CSV, JSON, ODBC or kdb+ formats.
Exporter
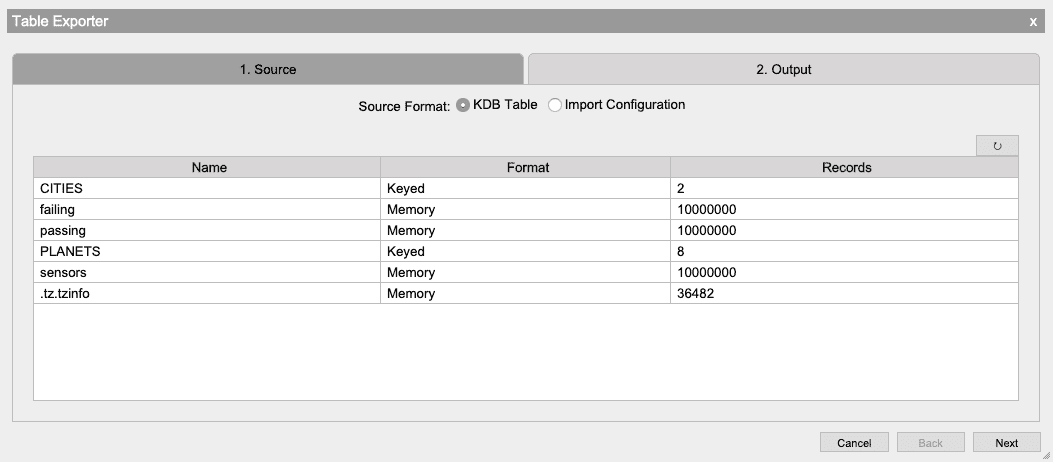
The Exporter allows the analyst to export datasets in CSV, INI, JSON, ODBC and kdb+ formats using a wizard-style interface. Kdb+ formats include memory, serialized, splayed, and partitioned tables.
Visual Inspector
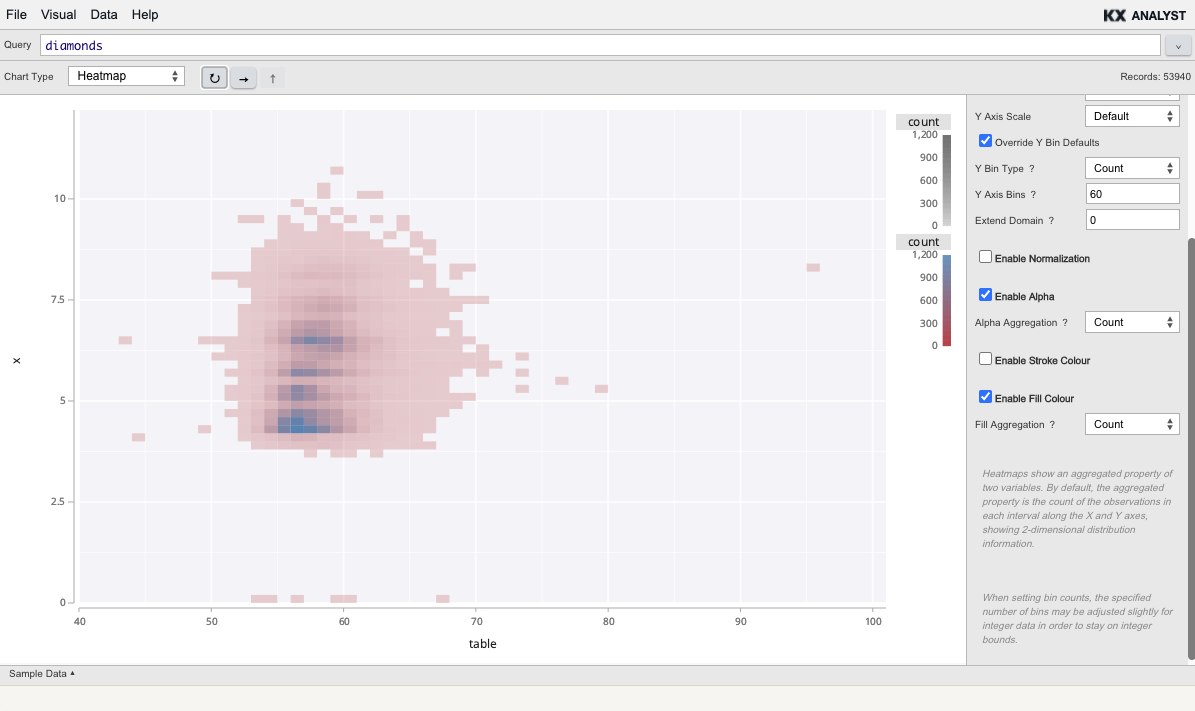
The Visual Inspector allows users to render datasets in a variety of visual formats. In the example below, the user is visualizing 100,000,000 records. In the example below, a 100×100 binned histogram visualization took about 5 seconds to render using 2 cores of an Amazon EC2 r3.4xlarge instance. This approach makes it possible to treat ‘big fast data’ as if it were ‘small data’ by allowing the user to ‘tumble, turn and explore’ the data, effectively in real time. With the Visual Inspector, the user can plot, zoom, and brush data in the following formats:
- Standard tabular data
- Horizontal or vertical histogram
- Heatmap
- Scatter
- Box Plot
- Quantile
- Horizontal and vertical bar
- Line
- Path
- Plot Matrix
- Directed Graph
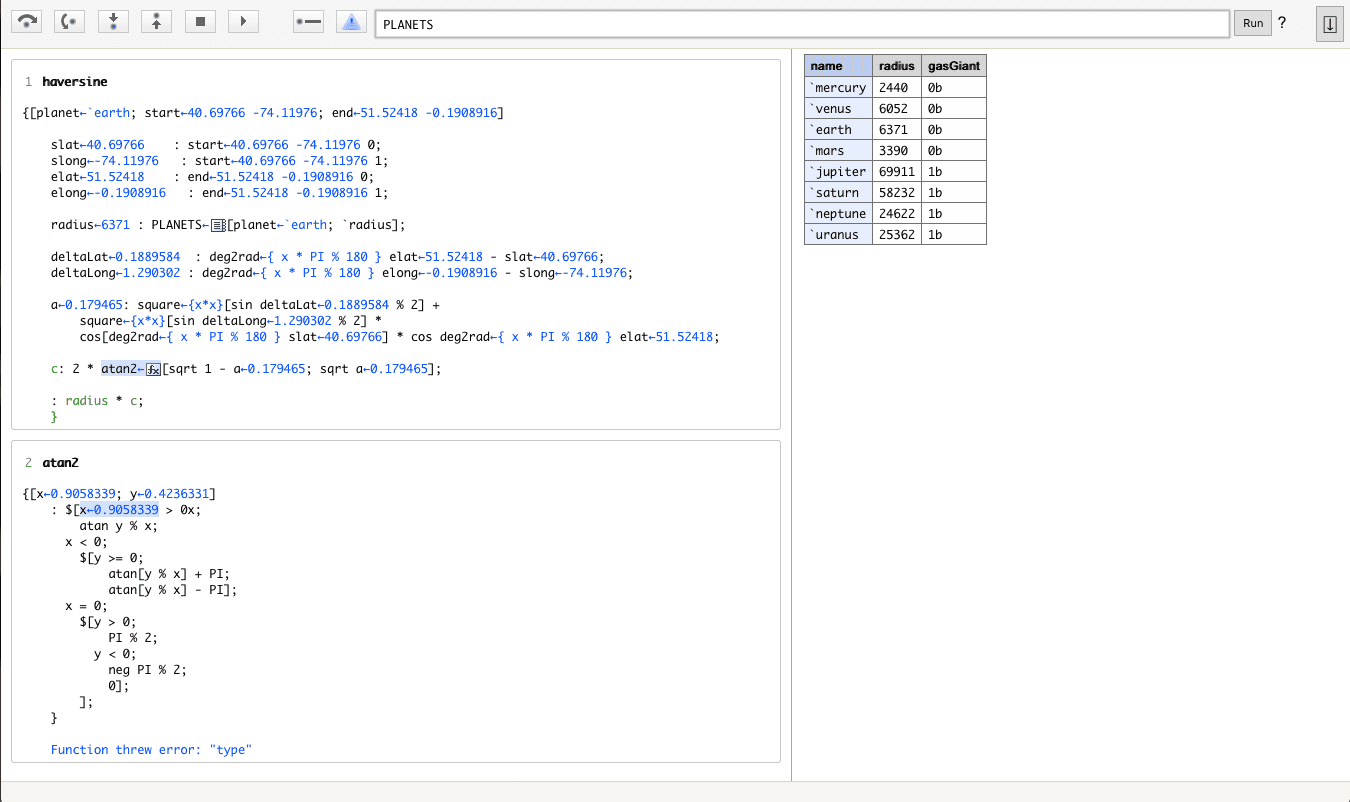
Interactive code editor
For experienced programmers, KX Analyst’s multi-pane q development environment and interactive code editors dramatically improve productivity by coupling traditional code-editing features with a host of interactive features. Features include:
- Syntax highlighting
- Code completion
- Context-sensitive reference help
- Breakpoint setting
- Find and replace
- Integration with the visual inspector
- Integration with the debugger
- Integration with version management
- Integration with console output
- QDoc output
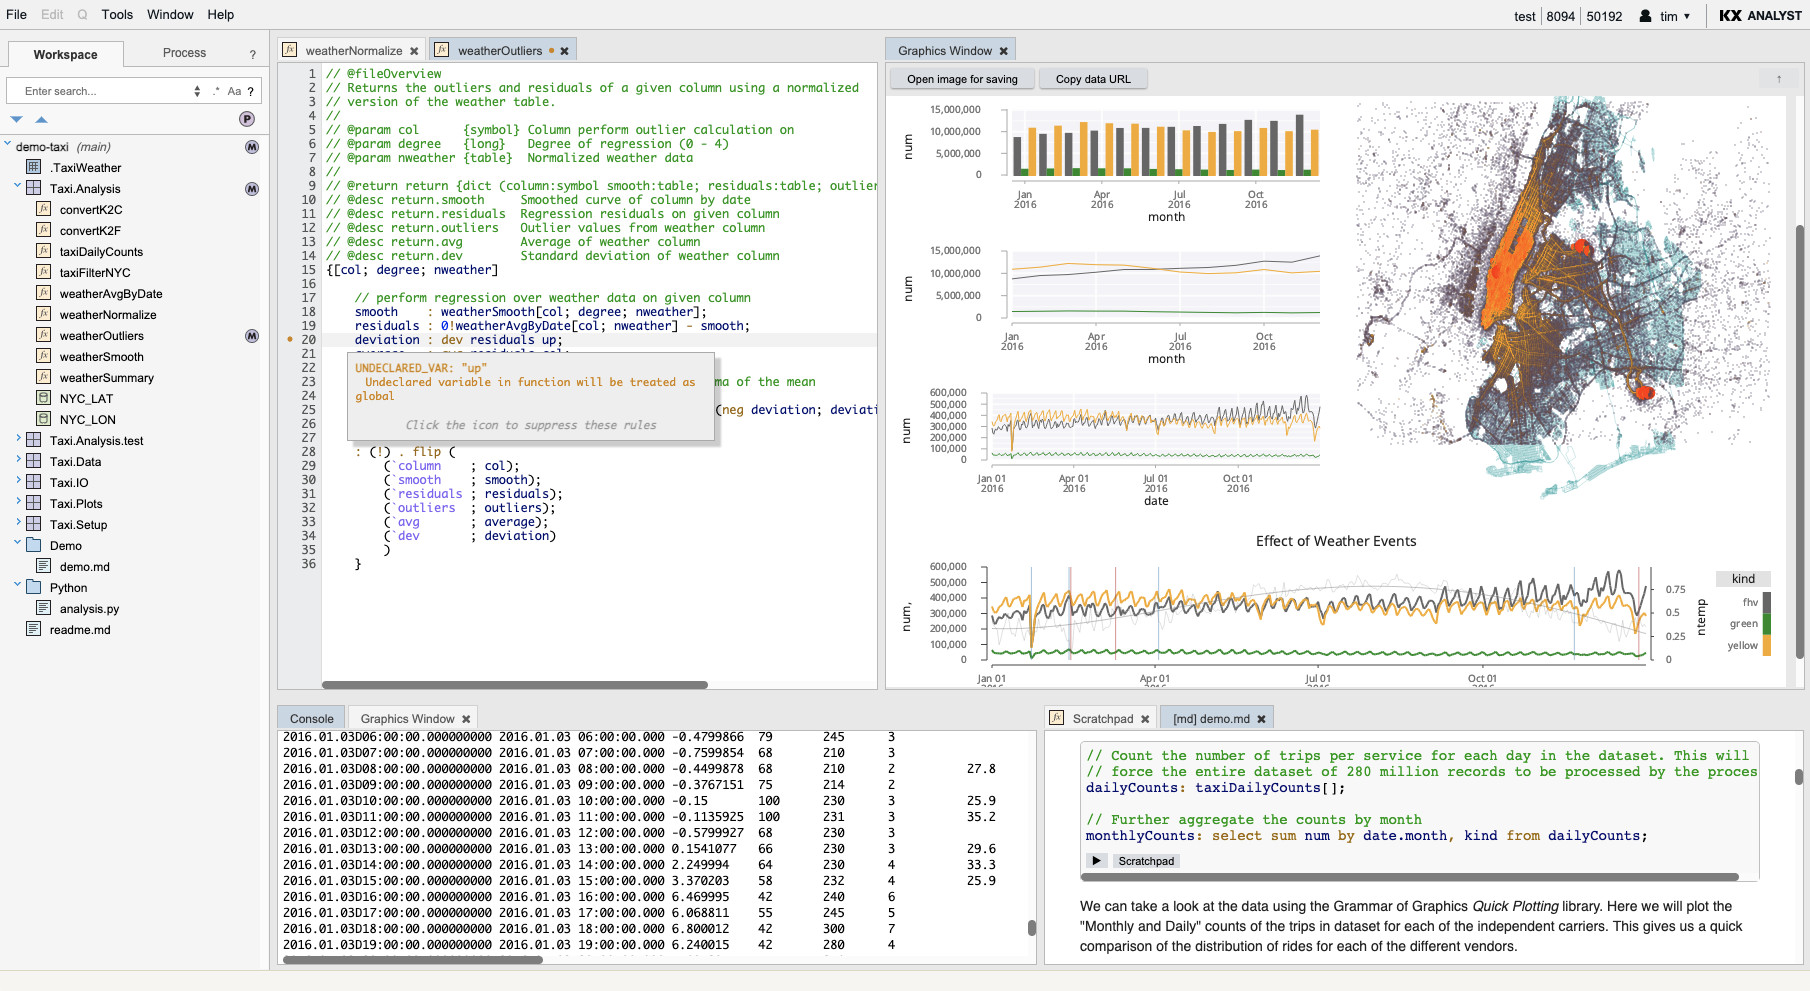
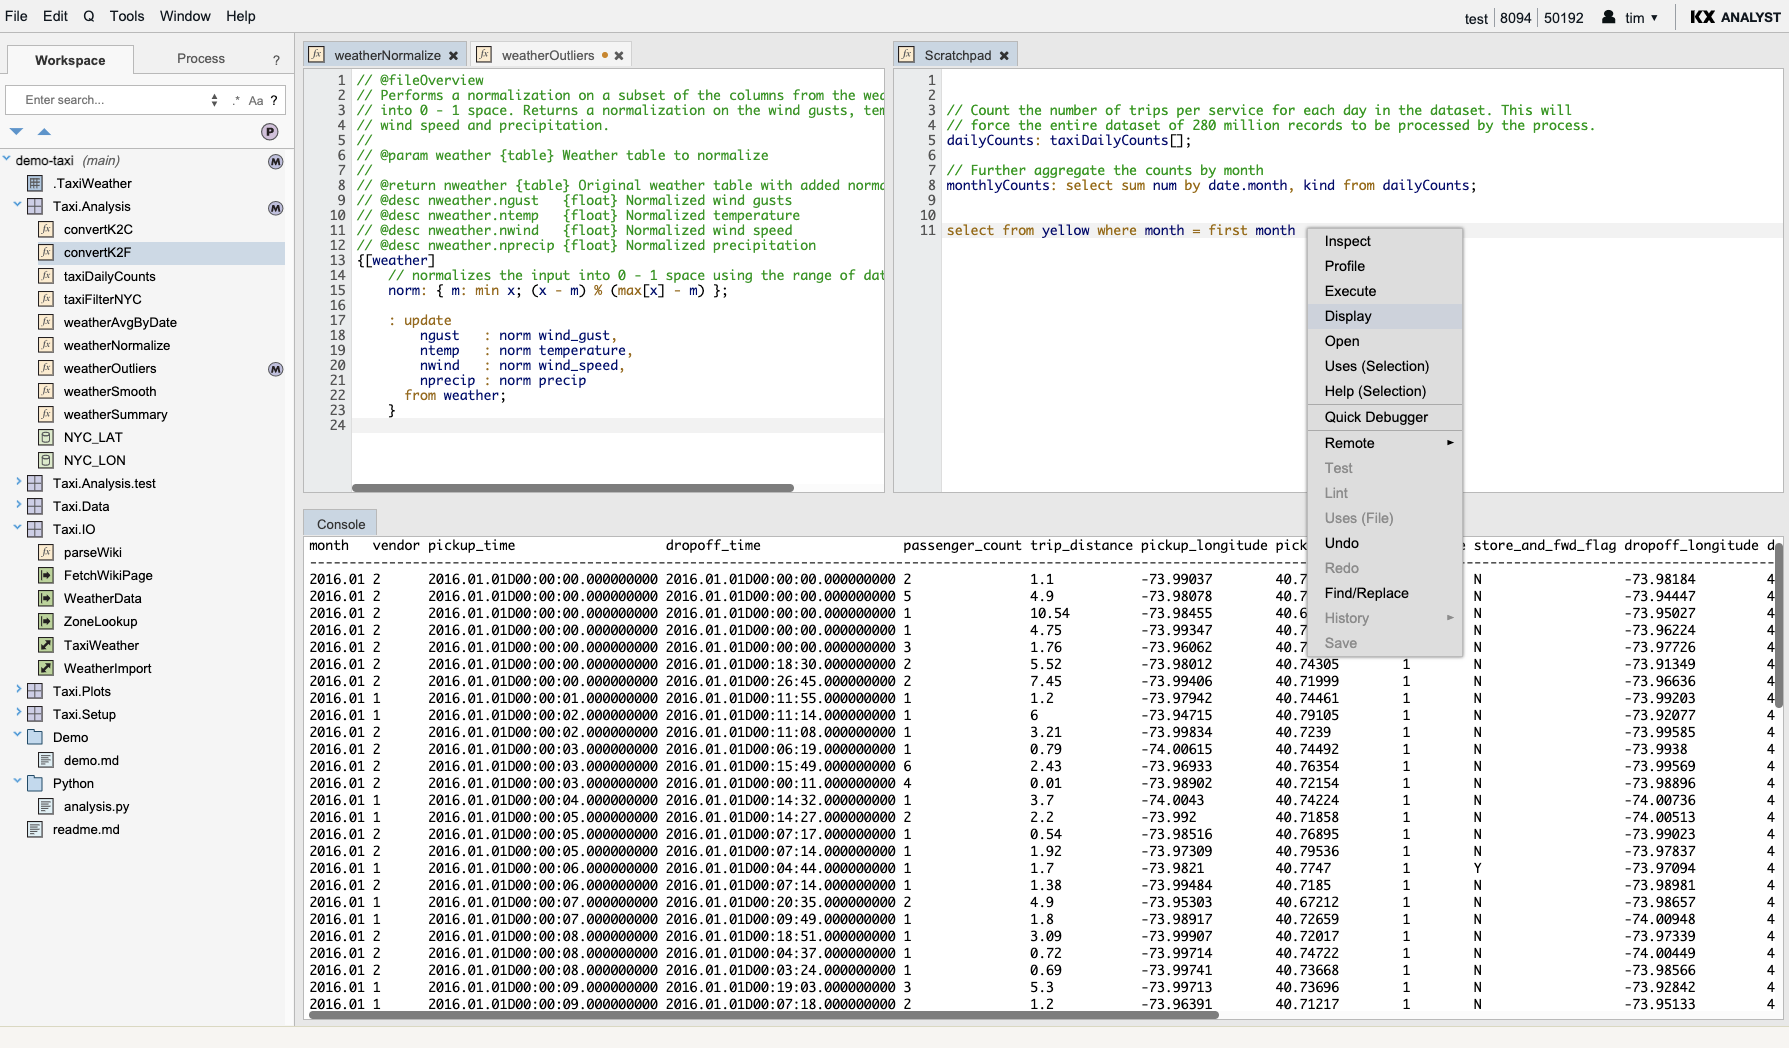
In the example below, you can see the developer’s local repository in the tree on the left. The tree contains powerful filtering features that enable the user to focus on the task at hand. On the right, three panes are open, containing a variety of tabbed windows (e.g. a scratchpad for experimenting, a q function, a behavior-driven q test featuring QuickCheck tests, and a console for interactively displaying output). The user has clicked the context menu and is in the process of displaying the contents of a code snippet in the console.
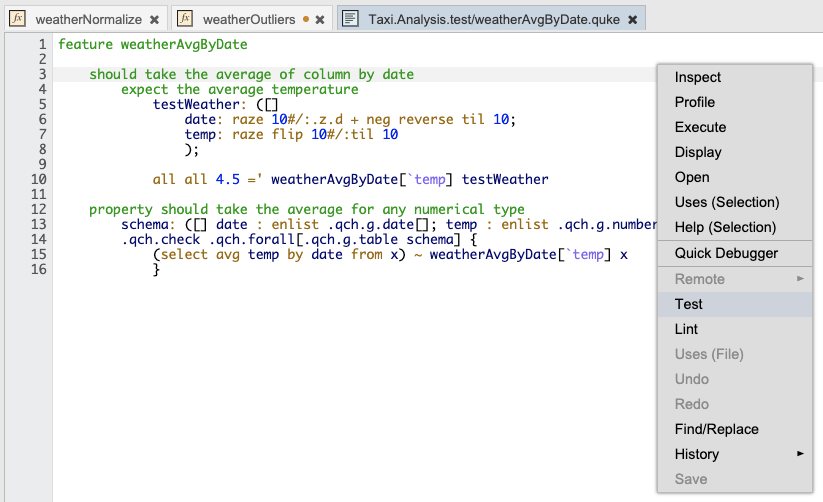
Behavior-driven development (BDD) and prototype-based test frameworks are integrated into the environment to facilitate test-driven development. The examples below illustrate a typical test and how it can be run from the workspace context-menu.
Debugger
The Debugger allows you to debug function execution. In the example below, the user interrogates a table assignment to understand where a type error may be occurring.
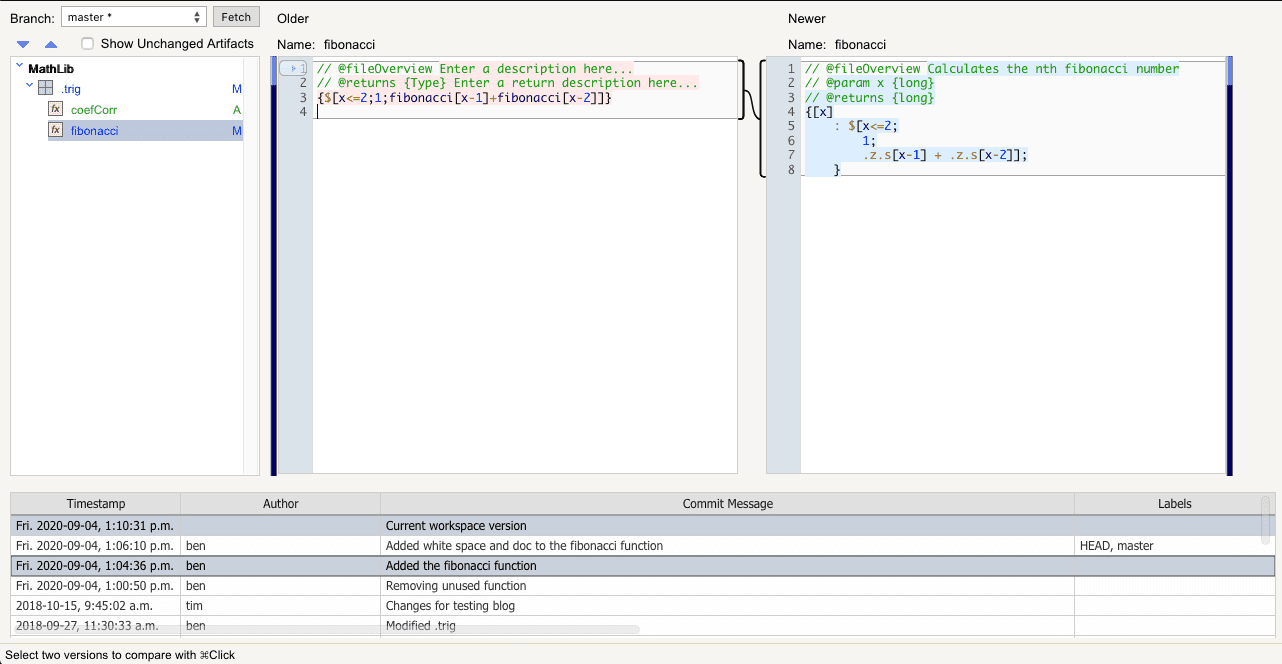
Code differ
Programmers can push and pull code modules to and from the shared repository from the tree and can compare the differences inside of a module using the Code Differ. This tool allows you to compare different versions of artifacts in the system. In the example below, the user is comparing two versions of a published function.