AxLibraries
This page explains how AxLibraries integrate with the kdb Visual Studio Code Extension and how to use their features within your development workflow.
AxLibraries provide additional tooling for KDB-X, including visualization libraries and static analysis utilities. When installed locally, these libraries can be used inside the kdb Visual Studio Code Extension.
The extension currently integrates the following AxLibraries features:
- Grammar of Graphics
- q static linter
Install AxLibraries
To use AxLibraries inside VS Code, you must install them in your local q environment. For that, follow the installation instructions.
Grammar of Graphics
Grammar of Graphics (GG) is a scripted visualization library for KDB-X.
GGPlot2 in VS Code allows you to create detailed and informative visualizations, helping you understand the underlying patterns and trends in your data more clearly without having to switch to RStudio. For more information refer to the GGPlot documentation.
Using GGPlot2
To use GGPlot2 in the kdb Visual Studio Code Extension:
-
Create a
my qconnection to the port to load the library. -
Write a script to query and load data. Make sure to clean and prepare the data for visualization, ensuring it is in a format suitable for analysis.
-
Use GGPlot2 to create visualizations, such as a bar plot showing the total transaction amount by month.
-
Run the script within the kdb Visual Studio Code Extension. The chart is generated and displayed in the VS Code plot viewer, and you can save the plot.
Note
When executing GG scripts, calling
.qp.display2displays the plot locally.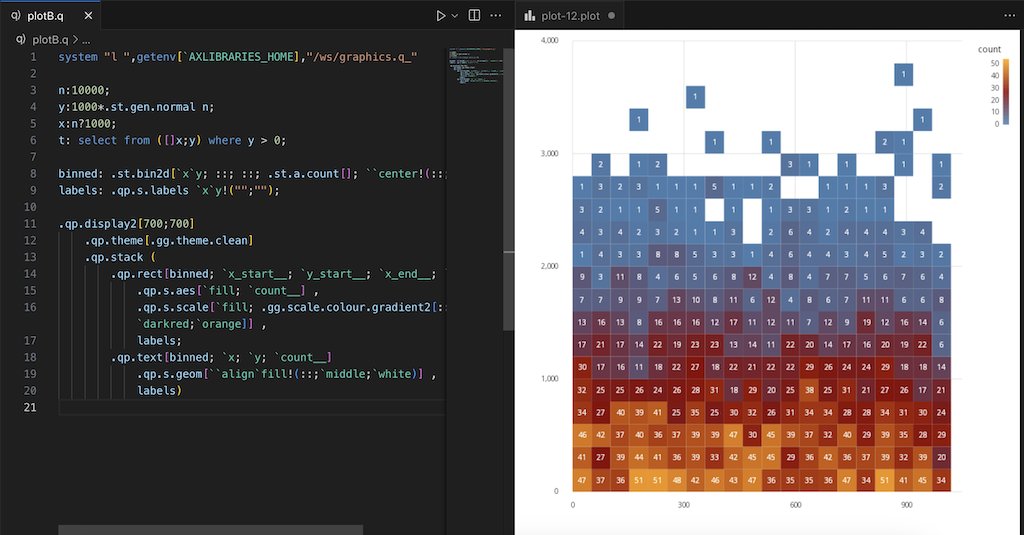
You can always make changes to the script before exporting the plot. Re-running the script updates to reflect the changes.
When executing GG script commands, make sure the KDB RESULTS view is open. If it isn’t visible when the script executes, the chart cannot be rendered and raw bytes will appear in the Output tab instead. When rendering succeeds, the plot opens in its own separate tab.