Data Sources
This page explains the purpose and structure of Data Sources in the kdb Visual Studio Code Extension.
Data Sources provide an interface for building, setting your query options, and executing queries against kdb Insights Enterprise API endpoints directly from within VS Code. They allow you to retrieve data from Insights deployments without writing full q or Python scripts, and they support qSQL, SQL, and API-driven workflows depending on the capabilities of your deployment.
Each data source is represented by a .kdb.json file stored in the workspace and displayed in the DATASOURCES panel.
Data source features
A data source:
- Is listed in the DATASOURCES view in the primary sidebar
- Can be associated with a connection
- Has the kdb.json extension
- Is stored in a .kx folder at the root of your open folder
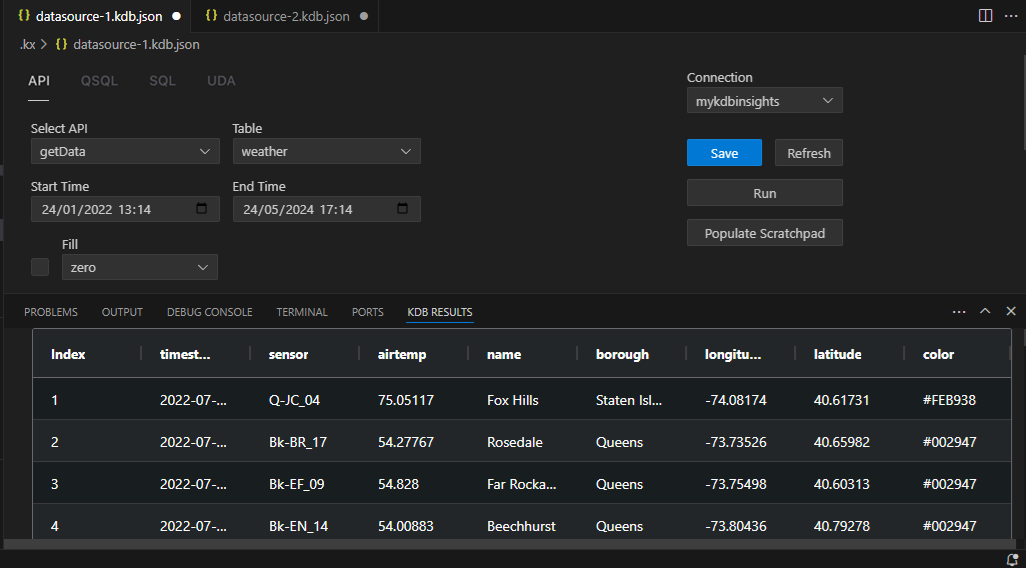
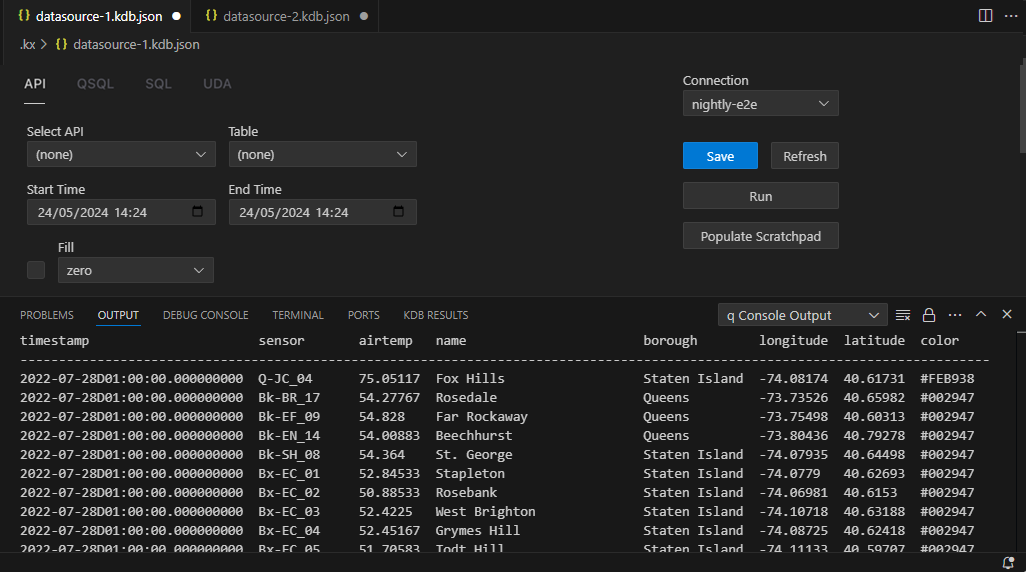
The data source screen helps you to build a query, based on the available API on your instance of kdb Insights Enterprise, parameterize it and return the data results to the output or kdb results window.
Create and run a data source
To create a data source and run it against a specific connection:
-
Ensure you have at least one folder open in VS Code.
-
In the DATASOURCES view, click +.
-
Select a connection and a tab to run:
- API queries (for example,
getdata) - qSQL queries
- SQL queries
- UDA queries (User-Defined Analytics)
- API queries (for example,
-
Click one of the available actions, depending on your needs:
- Save - Stores the current parameters and the associated connection so the data source can be reused later.
- Refresh — Reloads metadata from the connected Insights deployment, such as updated table lists or API changes.
- Run - Executes the query.
- Populate Scratchpad - Executes the query and writes the returned dataset into a variable in your scratchpad process. This feature is available only for kdb Insights Enterprise connections.
When you click Run the data source, the results are populated in the KDB Results window, if it is active.

Otherwise the Output window is populated.

The data source icon is green when its associated connection is active, and grey when the connection is disconnected or no connection is associated.