View Results
This page explains how query results are displayed in the kdb Visual Studio Code Extension.
All queries executed through the extension - whether from source files, Workbooks, Notebooks, Data Sources, or the REPL - are run remotely on a connected q process or, in the case of kdb Insights Enterprise, on your user-specific scratchpad or selected database tier. The results are returned to VS Code and displayed in one of two locations: the Output window or the KDB RESULTS view.
Output window
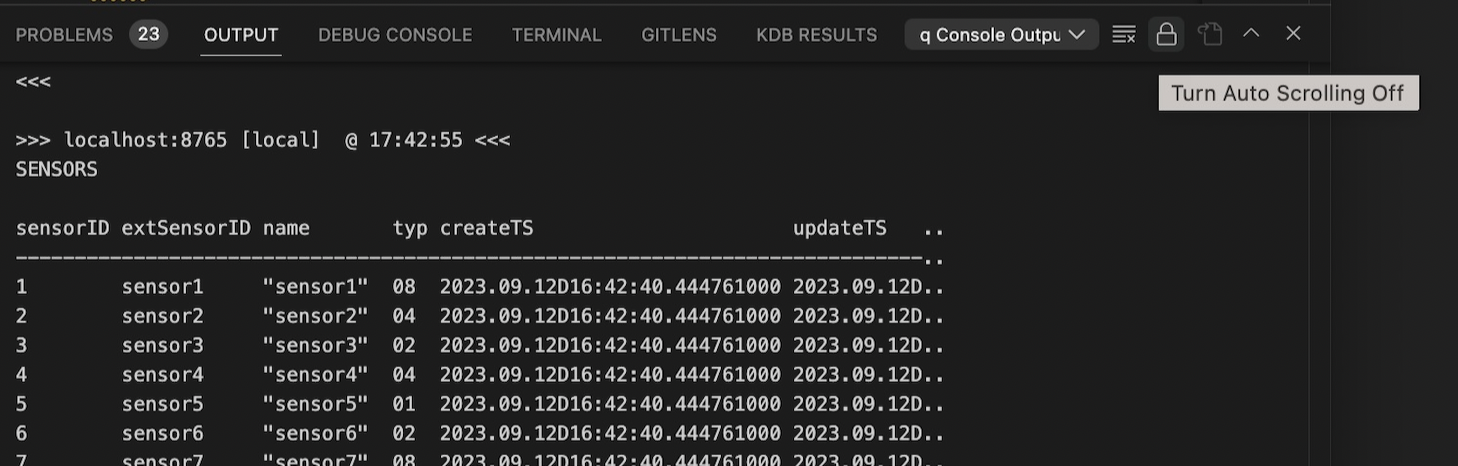
The Output window provides a text-based representation of query execution. It displays results as they are received by the kdb Visual Studio Code Extension. It includes:
- The code or query that was executed
- A timestamp
- Any returned text or diagnostic output
This view is especially useful when running commands that produce textual output, logs, or error messages.
You can control the scrolling behavior of the Output window using VS Code settings. Auto-scrolling ensures that the latest results remain in view as new output appears.
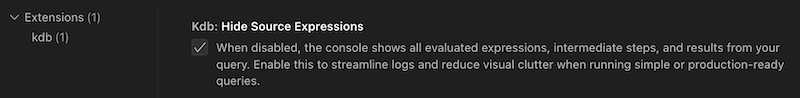
The kdb Visual Studio Code Extension also allows you to hide or show the full source expression that was executed. This can help reduce noise when running frequent or long queries. In Settings, check the option Hide Source Expressions (this option is checked by default).
KDB RESULTS view
The KDB RESULTS view is designed for tabular data returned from q, SQL, qSQL, or API queries. Results are formatted into an interactive table, making it easier to:
- Inspect columns
- Sort or filter data (depending on VS Code capabilities)
- Validate results before continuing analysis

Note
The Output tab opens automatically when results are returned (unless this behavior is disabled in settings), while the KDB Results view does not open automatically and must be opened manually to view tabular data.
Next steps
- Learn more about the kdb Visual Studio Code Extension settings