Visualize Streaming Data
This page guides you through the steps to visualize streaming data in real-time in a View, by streaming the latest co-ordinates of a set of NY City subway trains to a data grid.
This walkthrough contains the following sections:
-
Creating a pipeline to ingest and transform the subway data and add it to a package
-
Create a View to visualize the subway data in a Data Grid
-
Adding a map to your View to display the subway data
A Kafka subway feed has been provided for use in this walkthrough. This feed generates live alerts for NYC subway trains, tracking which trains are stopped at stations. For each train it provides arrival time, station location coordinates, direction and route details.
Note
Refer to the Streaming Kafka Ingest walkthrough for details of to ingest and visualize Kafka streaming data using the CLI.
Create a pipeline
To create the pipeline:
-
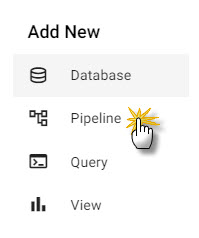
Click + on the ribbon menu and click Pipeline, as shown below.
-
In the Create Pipeline dialog, set the following:
Setting Value Pipeline Name subway-streamingSelect a Package insights-demoTo add the new view to the
insights-demopackage the package must not be deployed. If it is you must tear it down to proceed. -
Click Create.
The pipeline editor opens, as shown below.

The following sections guide you through the process of adding the following nodes to build your pipeline:
-
Kafka Node to ingest the data
-
Decoder Node to decode the data
-
Map Node to convert the decoded data to a kdb+ table
-
Transform Node to convert data fields to kdb+ compatible types
-
Subscriber Node to provide real-time updates of data
-
-
You can then:
Add a Kafka node
You begin your pipeline with a Kafka node to read the data from the subway feed we have provided.
-
Click-and-drag a Kafka node, from the Readers, into the workspace.
-
Select the Kafka node and add the following connection details to the Configure Kafka Node panel:
Setting Value Broker kafka.insights-data.kx.com:443Topic subwayOffset EndUse TLS Unchecked Use Schema Registry Unchecked -
Expand the Advanced parameters section and select Advanced Broker Options.
-
Click the + to add an advanced configuration and enter the following key value pairs:
Key Value sasl.username demosasl.password demosasl.mechanism SCRAM-SHA-512security.protocol SASL_SSL -
Click Apply.
Add a Decoder node
Kafka event data is in JSON and must be decoded to a kdb+ friendly format (a kdb+ dictionary).
-
Click-and-drag a JSON decoder node, from the Decoders, into the workspace, and connect it to the Reader node.
-
Click Apply, to keep the default JSON decoder settings.
Add a Map node
The decoded data needs to be converted to a kdb+ table. The Map node converts an incoming dictionary to a table using an enlist.
-
Click-and-drag a Map node, from the Functions, into the workspace, and connect it to the Decoder node.
-
Select the Map node and replace the code in the right-hand Configure Map Node property panel with the following code:
{[data] enlist data } -
Click Apply to apply this code to the Map node.
Add a Transform node
The next step is to add a Transform node which transforms the subway data fields to kdb+ compatible types and drops the fields that are not going to be displayed in the View.
Converting strings to symbols for use as keyed columns in the Subscriber node
The data from Kafka that is used in this example includes strings. The Subscriber node requires any columns defined as keyed columns to be symbols, integers, longs or GUIDs. This step is required to convert the strings in our data to symbols. Refer to the note on current limitations in the section on setting up a data source for views for further details.
If you are using a Subscriber node with your own data and the data in your keyed columns are already symbols, integers, longs or GUIDs this step is not necessary. See the next section for details on keyed columns.
-
Click-and-drag the Apply Schema node from the list of Transform nodes, and connect it to the Decoder node.
-
In the Schema section click the + icon under the Add schema columns below text and add the following columns, leaving Parse Strings set to Auto for all columns:
Column name Column type arrival_timeTimestampstop_nameSymbolstop_latFloatstop_lonFloatdirection_idSymbolroute_long_nameSymbolroute_colorSymbol -
Click Apply.
Add a Subscriber node
A Subscriber node emits a summarized view of the input data, with one record per unique combination of values in the list of keyed columns. The remaining columns are set to their latest values.
Once deployed, the emitted stream of data is available as a data source in a View. This is described in the Create a View section later.
In this example the node is configured so that it emits updates to the co-ordinates of trains per route and direction of travel (i.e. inbound or outbound).
-
Click-and-drag the Subscriber node, from the list of Writers into the central workspace, and connect it to the Apply Schema node.
-
Select the Subscriber node and set the Table to subway.
-
Add the following Keyed Column values:
Value route_long_name direction_id Defining these keyed columns ensures that:
- The output of the Subscriber node has one record per train route and direction.
-
Set the Publish Frequency to
100. This determines how regularly the subscriber updates the web-socket in milliseconds. -
Click Apply.
-
Click Save.
-
Click Packages in the left-hand menu to open the Packages index.
-
Click the three dots to the right of the
insights-demopackage and click Deploy.
Once the database and pipeline are deployed you can create a View of the data.
Create a View
Now that the data is being streamed to a pipeline containing a Subscriber node, you can create a View with a Data Grid to display the locations of the subway trains that are stopped at stations.
-
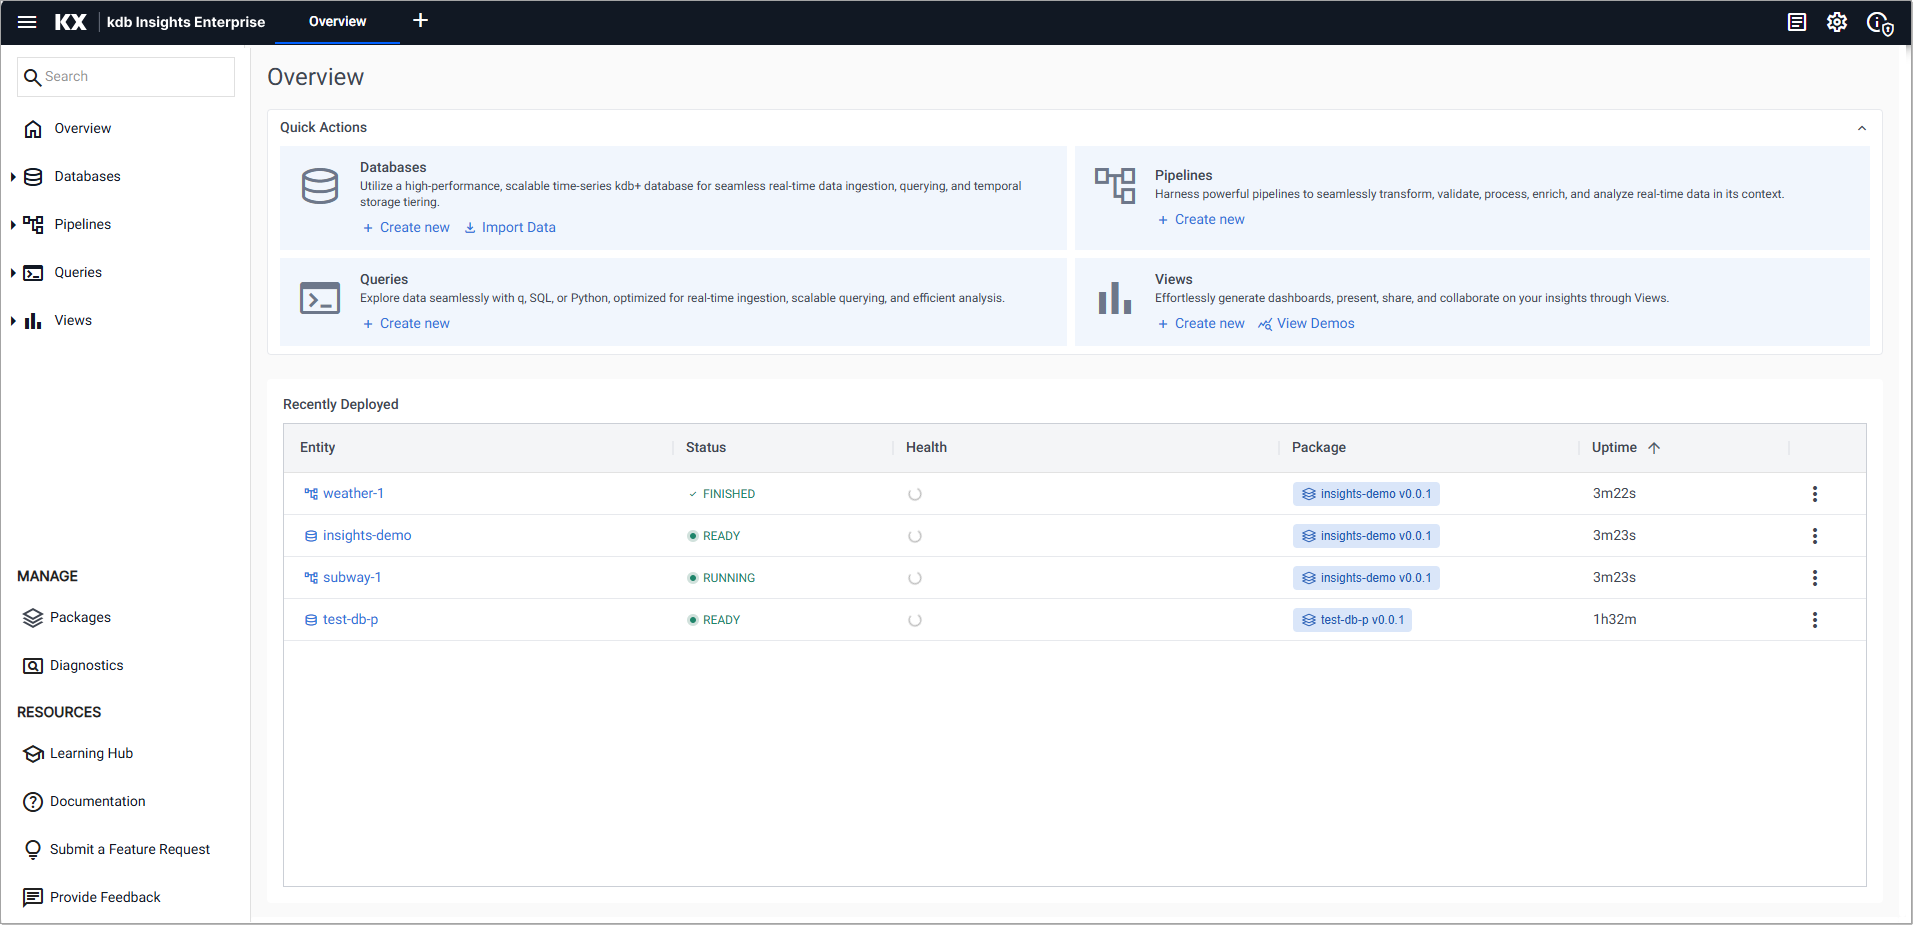
Select Create New under Views on the Overview page.
-
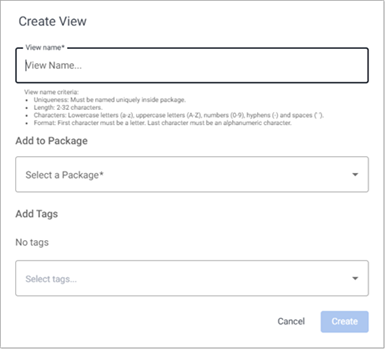
In the Create View dialog set the following:
Value Setting View Name insights-streaming-viewSelect a Package insights-demo -
Click Create
-
Click-and-drag a Data Grid, which is the first component on the list, from the icon menu into the central workspace.
-
In the Data Grid component, Click to populate Data Source to open the Data editor.
-
Click New to create a new data source and name it streaming.
-
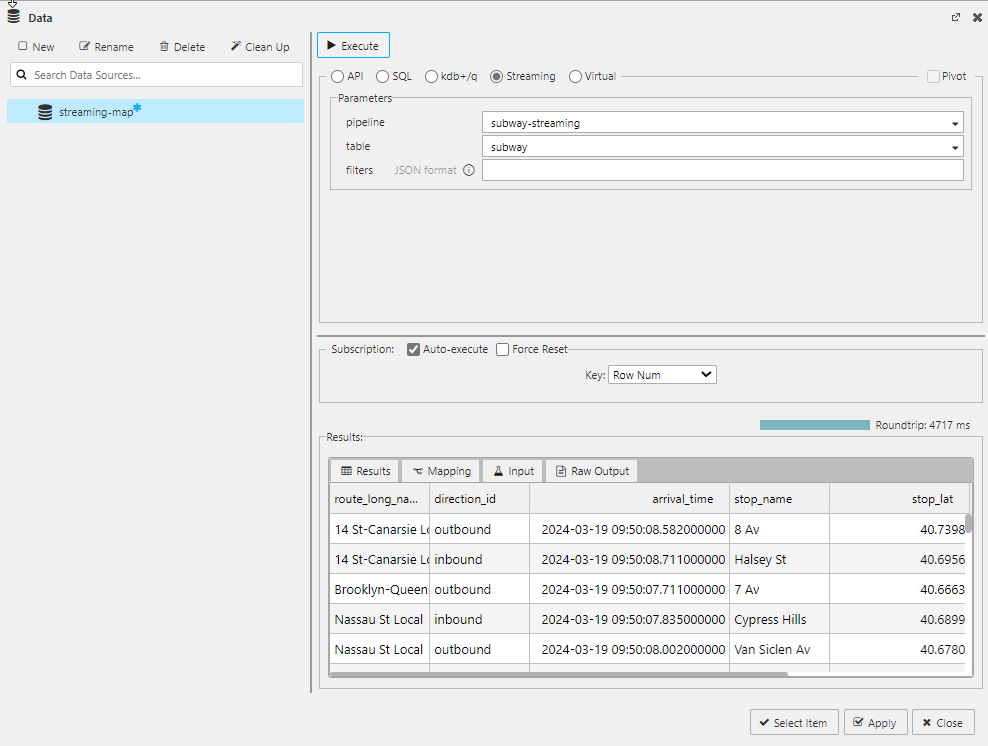
Click on the Streaming radio button and set the following properties:
Value Setting pipeline This is automatically populated with any running pipelines with a Subscriber node. Select subway-streaming. table This is automatically populated with tables associated with the pipeline selected. Choose subway. filters leave empty -
Click Execute to view the results in the Results panel at the bottom of the screen, as shown below. The streaming position values are displayed with updates visible as data is streamed.
-
Click Apply and then Select Item.
-
With the Data Grid selected, set the Sort Column, in the Basics properties, to route_long_name.
-
Save the View by clicking the Save Dashboard icon at the top of the workspace.
The Data Grid now displays a record per train showing the most recent stop along the NY City subway.
- If no data is displayed ensure that the package containing the database and pipeline are deployed. Go to the Package Index page, click the three dots to the right of the insights-demo package and click Deploy. This deploys the database and pipeline associated with your view.
Filtering the Data Grid
Now that you have a View that is being updated with streamed data you can add filters, based on any of the columns, to show a subset of the data.
-
With the Data Grid selected in the new View, click on Data Source value to open the Data dialog and choose the streaming Data Source from the list on the left-hand side.
-
Enter one of the example filters below:
filter filter description {"direction_id":"inbound"}All inbound trains {"route_long_name":["6 Avenue Express","7 Avenue Express","8 Avenue Express"],"direction_id":"inbound"}All inbound trains on the 6,7 or 8 Avenue Express routes Note
For details on the current limitations refer to the Streaming section of the setting up a data source for Views guide.
-
Click Execute to check that the results, displayed in the Results panel at the bottom of the screen, have applied the filter to the data.
-
Click Apply and then Select Item.
The Grid now lists records that match the filter being applied. The following example shows the grid being updated with data for all inbound trains only.
Filtering based on a drop-down
Having used a static filter to limit the Data Grid to a specific value in any column, we can enhance this by using a drop-down to filter the Data Grid to one or more specific values from a list.
-
With the View open, select Drop Down List from the list of components. Drag and drop it above the Data Grid.
-
With the Drop Down List selected, check the Multi-select checkbox in the Basics properties.
-
Expand the Items properties in the Basics properties.
-
Click + to add an item with Value and Text properties equal to
inbound. Repeat foroutbound.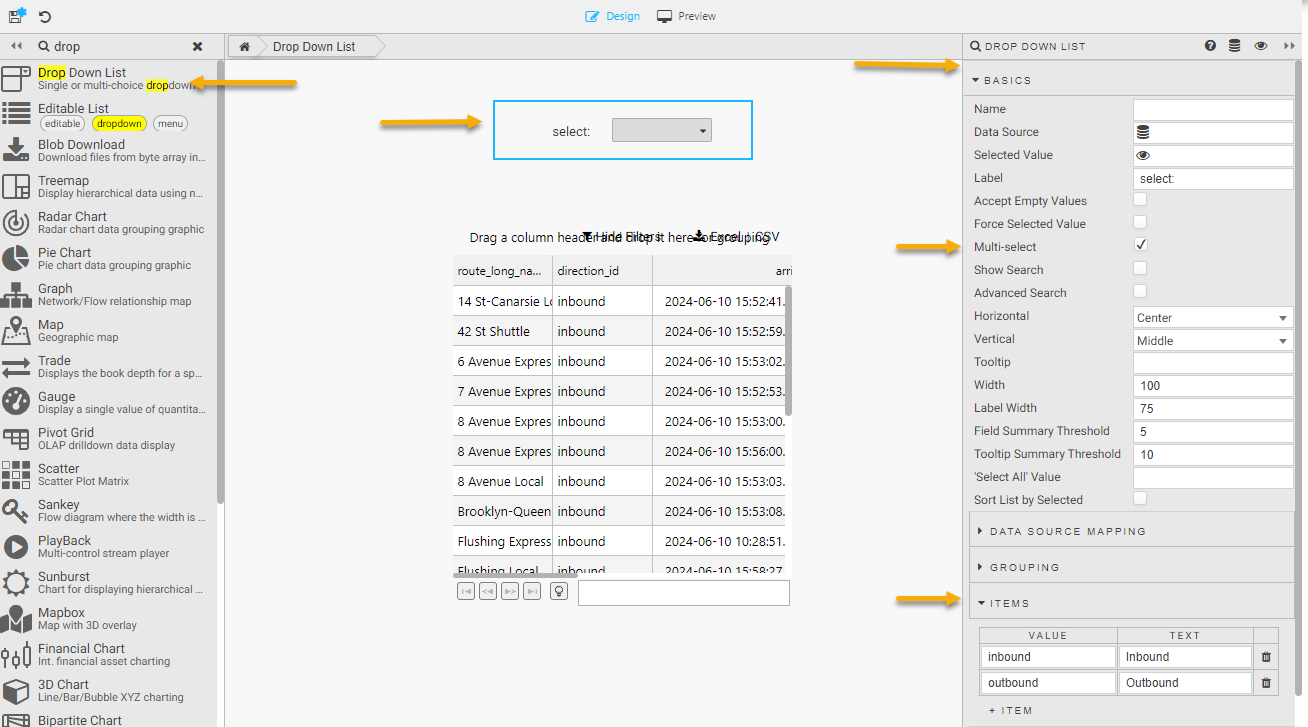
-
Create a View State parameter for the selected value in the Drop Down List:
-
Click on the Selected Value item of the Drop Down List.
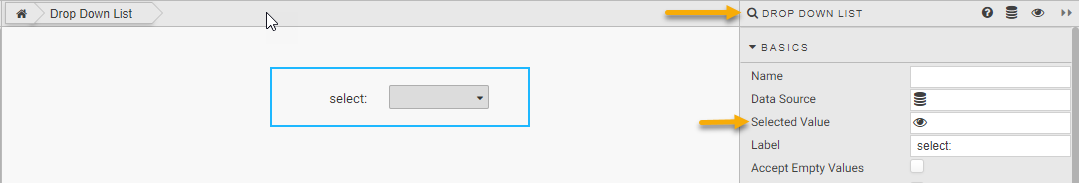
-
Click New to add a new view state and click Rename to change the name to
selected_direction. -
Set the Type value to
list. -
Set the Default and Value fields to
inbound -
Click Select Item.
The
selected_directionView State is now populated with the value chosen in the drop-down. -
-
Update the Filter in the Data Grid to use the new
selected_directionView State value.-
Select the Data Grid and click on the Data Source to open the Data dialog.
-
Update the Filter field to
{"direction_id":{{mydirection}}}. -
Click on the eye in the far right of the new mydirection text box below the Filter field and select
selected_directionfrom the list of View States displayed. -
Click Select Item.
-
-
Click Apply and then Select Item to close the Data Source screen.
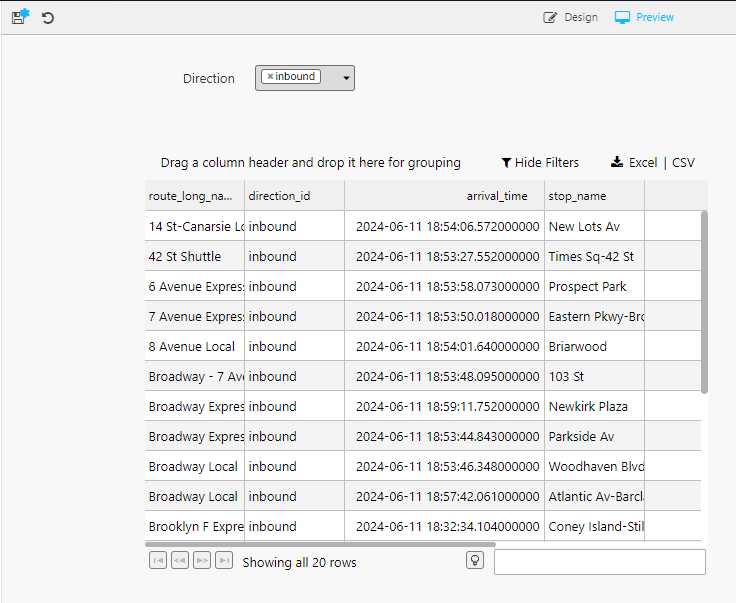
In Preview mode, choose the direction from the Drop-down List and the data grid is filtered appropriately. In the following example, the Direction selected is inbound and so only inbound trains are displayed:
Add a map
If you have an access to an API Key for Google Maps Platform you can add a Map (External APIs) component to your View to display the subway data.
This step is optional. To proceed, you must create an API Key for Google Maps Platform as described here.
To add a map to your View:
-
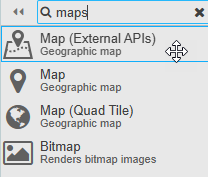
In the design mode for your View, search for the Map (External APIs) component in the list of components on the left, and drag it into the workspace.
-
Click on the Map (External APIs) component and configure it as follows:
-
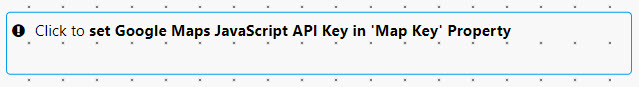
Click set Google Maps JavaScript API Key in Map Key Property. The Map Key is saved as a view state inside your view.
-
Click New and name the node
mapkey. -
In the Properties section for
mapkey, leave Type set toSymbol. Enter your API Key for Google Maps into the Default and Value properties and click Select Item.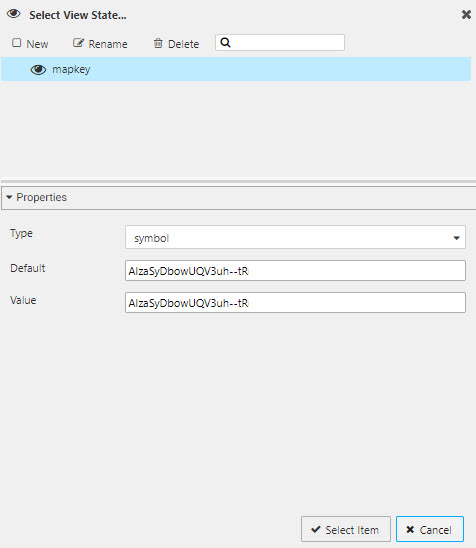
-
Centralize the map on New York by setting the values, in the following table, in the Map properties. These are illustrated in the screenshot below the table.
Setting Value CenterX 40.75CenterY -73.98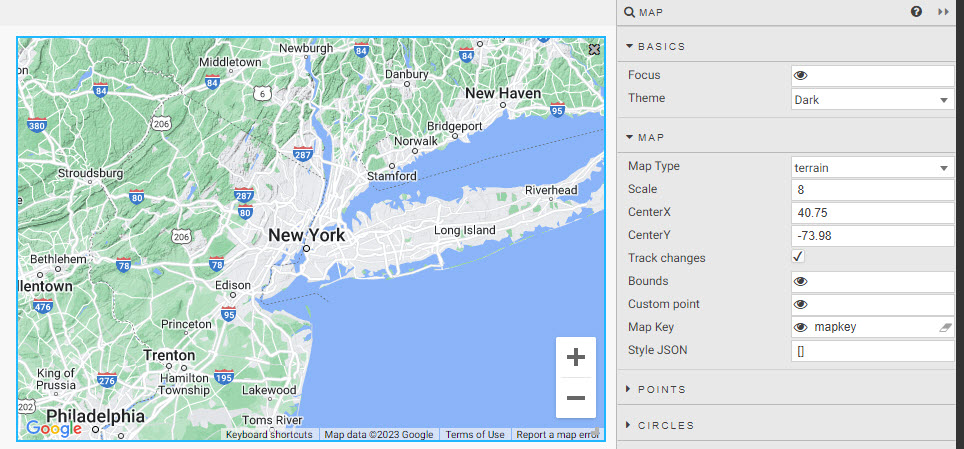
-
-
Define the Data Source from which the component will get data:
-
Click on Data Source in the Points properties.
-
Create a new data source and name it
streaming-map.
Note
If you want to share your filtering options for the Data Grid, select the existing
streamingdata source.-
Click on the Streaming radio button and set the following properties:
Value Setting pipeline subway-streamingtable subwayfilters leave empty
-
-
Click Execute to view the results in the Results panel at the bottom of the screen, as shown below. This displays the streaming position values with updates visible as data is streamed.
-
Click Apply and then Select Item.
-
To ensure the trains are named, positioned and colored on the map based on the streaming data set the Points properties as follows:
Properties Value Selected Attr route_long_nameLatitude Data stop_latLongitude Data stop_longShape trainShape Colour (From DB) route_colourCluster Unchecked -
Save the View by clicking the Save Dashboard icon at the top of the workspace.
Your View now contains a data grid and a map updating for all inbound and outbound trains, as illustrated below.