Troubleshooting Pipelines
This page provides help with identifying and fixing data pipeline issues, including common errors, log analysis, and corrective steps to keep data flowing reliably.
Pipeline status
The status of a pipeline is the first indicator of where exactly in the application stack an issue is occurring. To view the status of a pipeline:
- Go to the Overview screen.
- The Recently Deployed panel shows the current status of each running pipeline.
The full list of possible pipeline statuses can be found here.
Here are some examples of next steps you would take given a particular scenario surrounding a status:
Pipeline is stuck in Creating
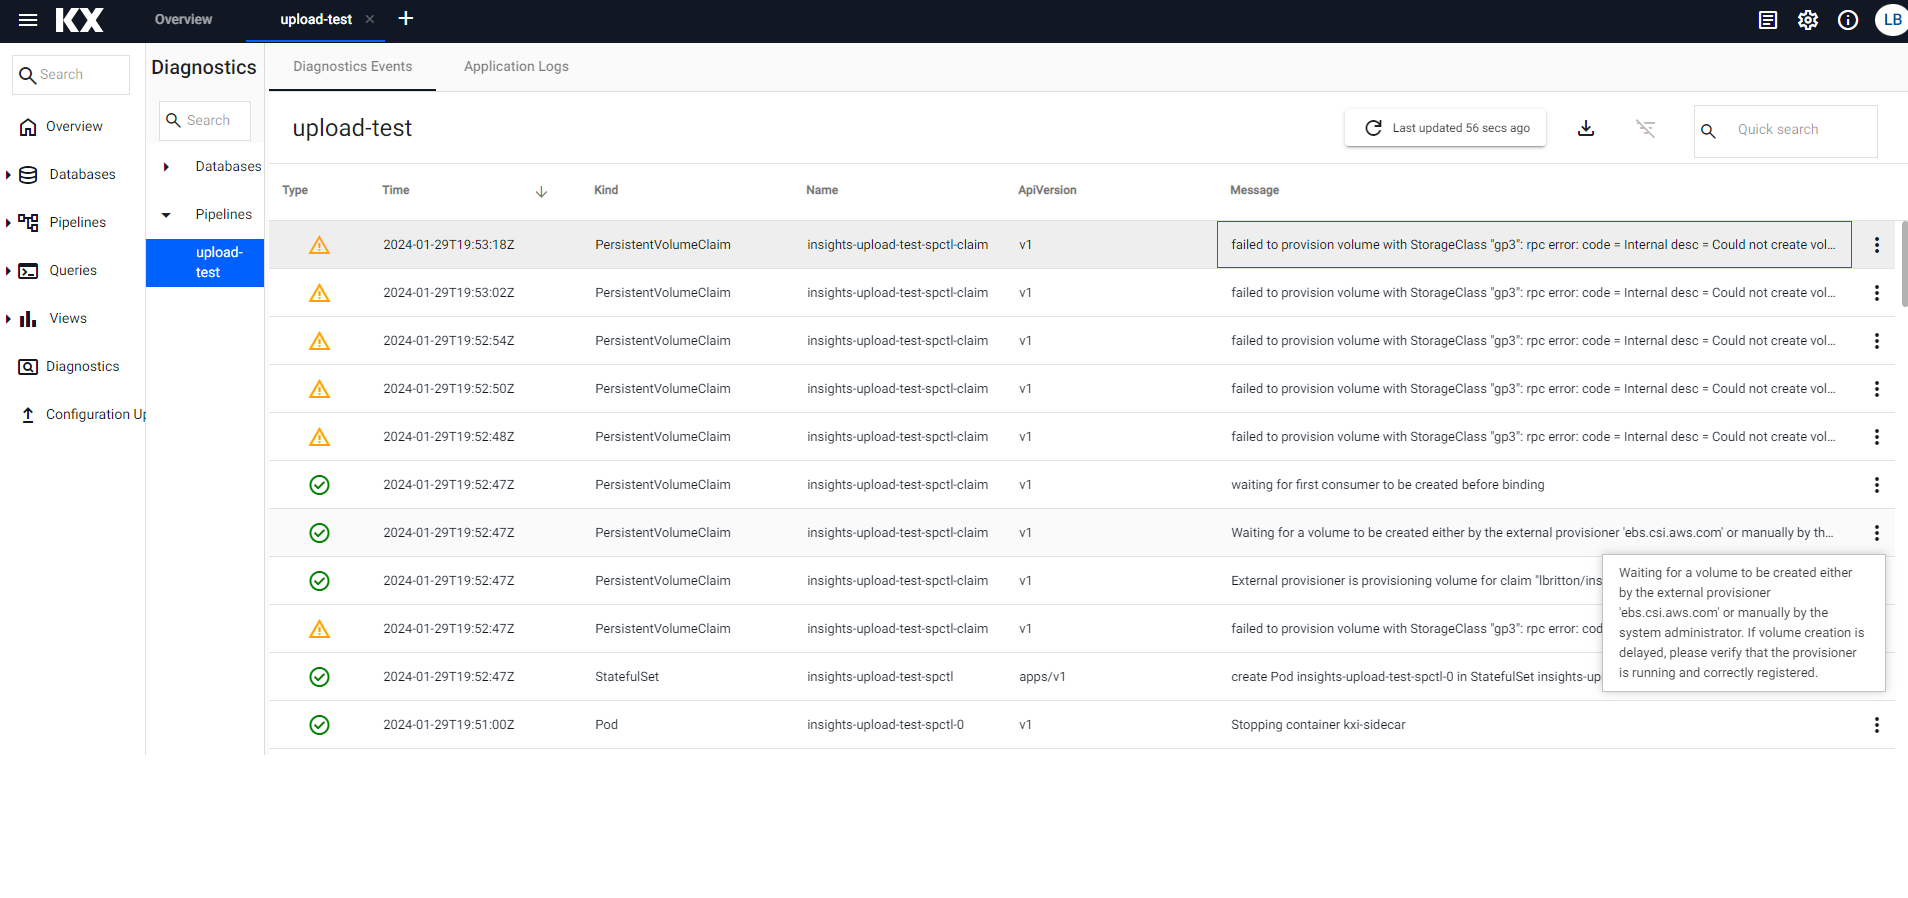
This usually implies that the SP Controller is having issues starting. A common cause of this can be that the service is waiting for a PVC request to be fulfilled. We can check if this is the case by viewing the pipelines Diagnostic Events, which gives a view of the system events that have been logged by the resources associated with the pipeline. If the pipeline is waiting on a PVC request to be fulfilled, you can expect a log message that looks something like the below:
AWS specific
It should be noted that the following event messages are specific to a kdb Insights Enterprise install running on AWS, other cloud providers are different, and the messages themselves could also be subject to change by AWS. Please only refer to them as rough examples of what to look for.
"Waiting for a volume to be created either by the external provisioner 'ebs.csi.aws.com' or manually by the system administrator. If volume creation is delayed, please verify that the provisioner is running and correctly registered."
If there is a problem provisioning the volume, this event message is often followed up with an error/warning message, such as the below:
"failed to provision volume with StorageClass \"gp3\": rpc error: code = Internal desc = Could not create volume \"pvc-fb493355-52a0-4917-b9b3-5a77935cbeb3\": could not create volume in EC2: InvalidParameterValue: Invalid integer value -8589934591\n\tstatus code: 400, request id: fc98bdb5-596e-425c-81f7-a8c1742f619e"
In many cases, errors like this indicate a resource issue on the Kubernetes cluster. There could be numerous causes for this with some examples being;
- The cluster has reached its PVC quota
- The pipeline is being scheduled to an availability zone without capacity or which is not available
- There are not enough CPU / memory resources remaining to support the workload
You should contact your system administrator to help identify the exact cause and remedy it.
Note
This issue can also occur when the pipeline is in an Unresponsive status.
Pipeline status is Errored
This indicates that the pipeline pods were able to start successfully, but the pipeline itself ran into an error when it tried to run or while it was running. In this scenario, the first step would be to investigate the logs of the pipeline. Investigating a pipeline's logs is discussed further below.
Pipeline status is Unresponsive
An unresponsive status indicates that the pipeline's SP Controller is not responding to HTTP requests. If you are seeing this status in your pipeline, click the View Diagnostics button on the pipeline to investigate.
The following can be a common cause of this status:
Secret Not Found
For readers such as Amazon S3, there is an option to specify a Kubernetes secret when Use Authentication is set to true.
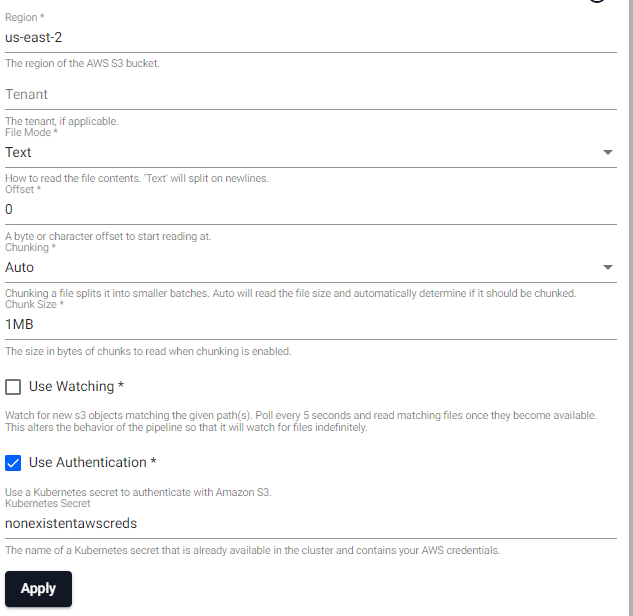
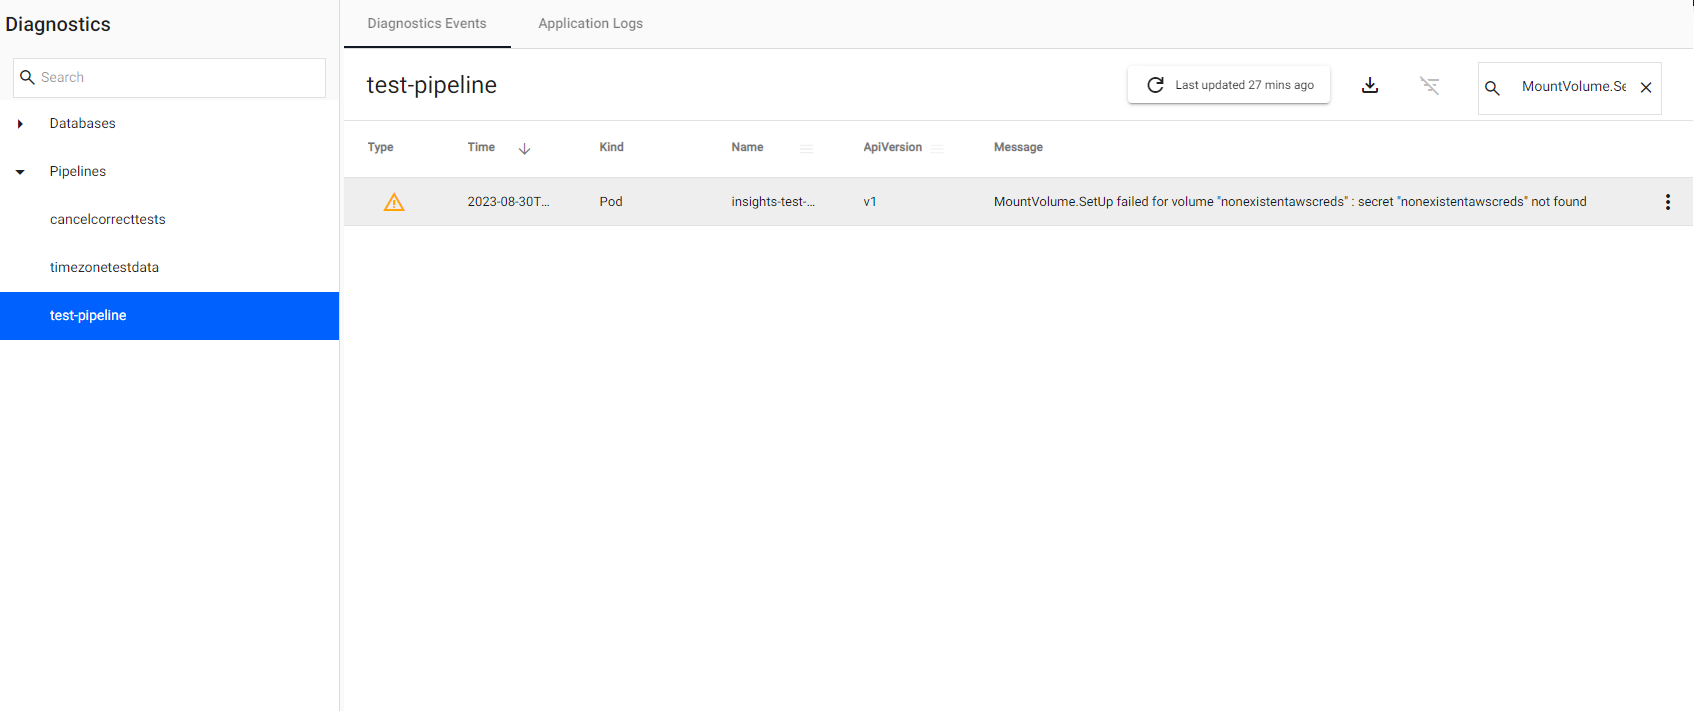
If the secret specified doesn't exist, the pipeline goes into an Unresponsive status. In such cases, if you click on View Diagnostics and go to the Diagnostic Events tab, to see the following error:
MountVolume.SetUp failed for volume "nonexistentawscreds" : secret "nonexistentawscreds" not found
The error can be resolved by creating the missing secret. Contact your system administrator to create this.
Once the missing secret has been created, the pipeline picks up, move out of the Unresponsive status, and progress as normal.
Secret name
The secret name nonexistentawscreds is just an example to highlight that the secret didn't exist.
Please choose a more appropriate name when naming your secrets! For example, awscreds.
Pipeline is stuck in the status Tearing down
When you teardown a pipeline, the pipeline moves into a Tearing down state. Normally the process of tearing down a pipeline is relatively quick, however sometimes it can take longer, particularly if you have selected to clear the pipeline's checkpoints, which means deleting the PVC of the SP Workers associated with the pipeline. Depending on the size of the worker PVCs, this may take a few minutes. Any longer and this may indicate that there's an issue.
A typical cause of this can be that a PVC associated with the pipeline is stuck in a Terminating state. To investigate this issue further, please contact your system administrator responsible for managing your kdb Insights Enterprise install.
Pipeline Logs
When a pipeline enters into an Errored state, the first point of action is to review the logs to see what the error is and where exactly in the flow of the pipeline it has occurred.
Viewing the Application Logs
To view the logs of a running pipeline, refer to troubleshooting diagnostics.
Refer to Understanding logs for details on logs levels.
How to turn on Debug Logging
To turn on debug or trace logging before a pipeline has been started do the following:
- Go to the Overview screen.
- In the side panel on the left-side click Pipelines.
- Click on the pipeline you're planning to start with debug or trace logging enabled.
- Click on the Settings'tab.
- Under the Runtime section there is a drop-down for Log Level. Select
Debugto turn on debug logging orTraceto turn on trace logging. - Click Save & Deploy to run the pipeline with the new settings.
- Go to the Application Logs to see additional Debug or Trace (depending on which you enabled) logging along with regular log messages.
Column Filters
To filter one of the columns in the Application Logs do the following:
- Go to the Application Logs.
- Hover over the name of the column you would like to filter.
- 3 Horizontal bars appears to the right of the column name. Click on the horizontal bars.
- A pop-up box appears with a drop-down containing filter rules you can apply and a text box where you can enter the text you want to filter on. Select a rule and enter the text to filter on. As you type you'll notice a secondary dropdown and text box pops-up along with AND/OR radio buttons. Use these if you wish to add an additional rule to your filtering, otherwise ignore.
- The filter is applied in real-time as you type. The log messages are filtered based on the rule you apply.
Understanding logs
When investigating an error in a pipeline, understanding the context of the log messages surrounding an error can be just as important as understanding the error itself. This is because the surrounding messages provide information about where exactly in the flow of the pipeline the error occurred. To get a better grasp of this refer to Pipeline logs for details on logs levels and key log messages for the SP Controller and SP Worker.
Pipeline Testing
Another useful tool that can help in an investigation of an Errored pipeline is the Test Pipeline utility. This utility allows you to spin up a test version of a pipeline for debugging. This test pipeline has data tracing enabled, meaning the data inputs and outputs of each pipeline node is logged. You can read more about test deploys here.
Memory Management
Some pipelines can have large or complex memory requirements, which can result in excess memory usage or hitting memory limits. For more information, refer to the Memory management.
Pipeline workers can have their memory limits configured explicitly, use this to increase the amount of available memory.
Configure the limits in the web interface using the Settings tab, or in the package manifest:
...
worker:
  k8sPolicy:
    resources:
      limits:
        memory: 16Gi
...
In cases where memory usage may be higher than expected refer to Additional garbage collection for more details.
Further troubleshooting assistance
-
Cloud Readers - try downloading the file using the cloud provider's CLI to debug errors.
-
Cloud Writers - try uploading the file using the cloud provider's CLI to debug errors.
-
Diagnostics API - useful for gaining a complete picture of the current state and configuration of the worker.
-
Memory management covering the basics, addressing common issues, and providing some general troubleshooting tips.