Ingest Protocol Buffers Data
This page provides a walkthrough to guide you through the steps to create a pipeline to ingest Protocol buffers data into kdb Insights Enterprise.
Protocol buffers are Google's language-neutral, platform-neutral, extensible mechanism for serializing structured data. We have provided a crime data set for use in this walkthrough, which is a record of events from March 31st 2022 in NYC, organized by precinct, including location coordinates of the call, dispatch times, and a description of the crime.
No kdb+ knowledge required
No prior experience with q/kdb+ is required to build this pipeline.
Before you build your pipeline you must ensure the insights-demo database is created, as described in the this walkthrough.
Create a pipeline
-
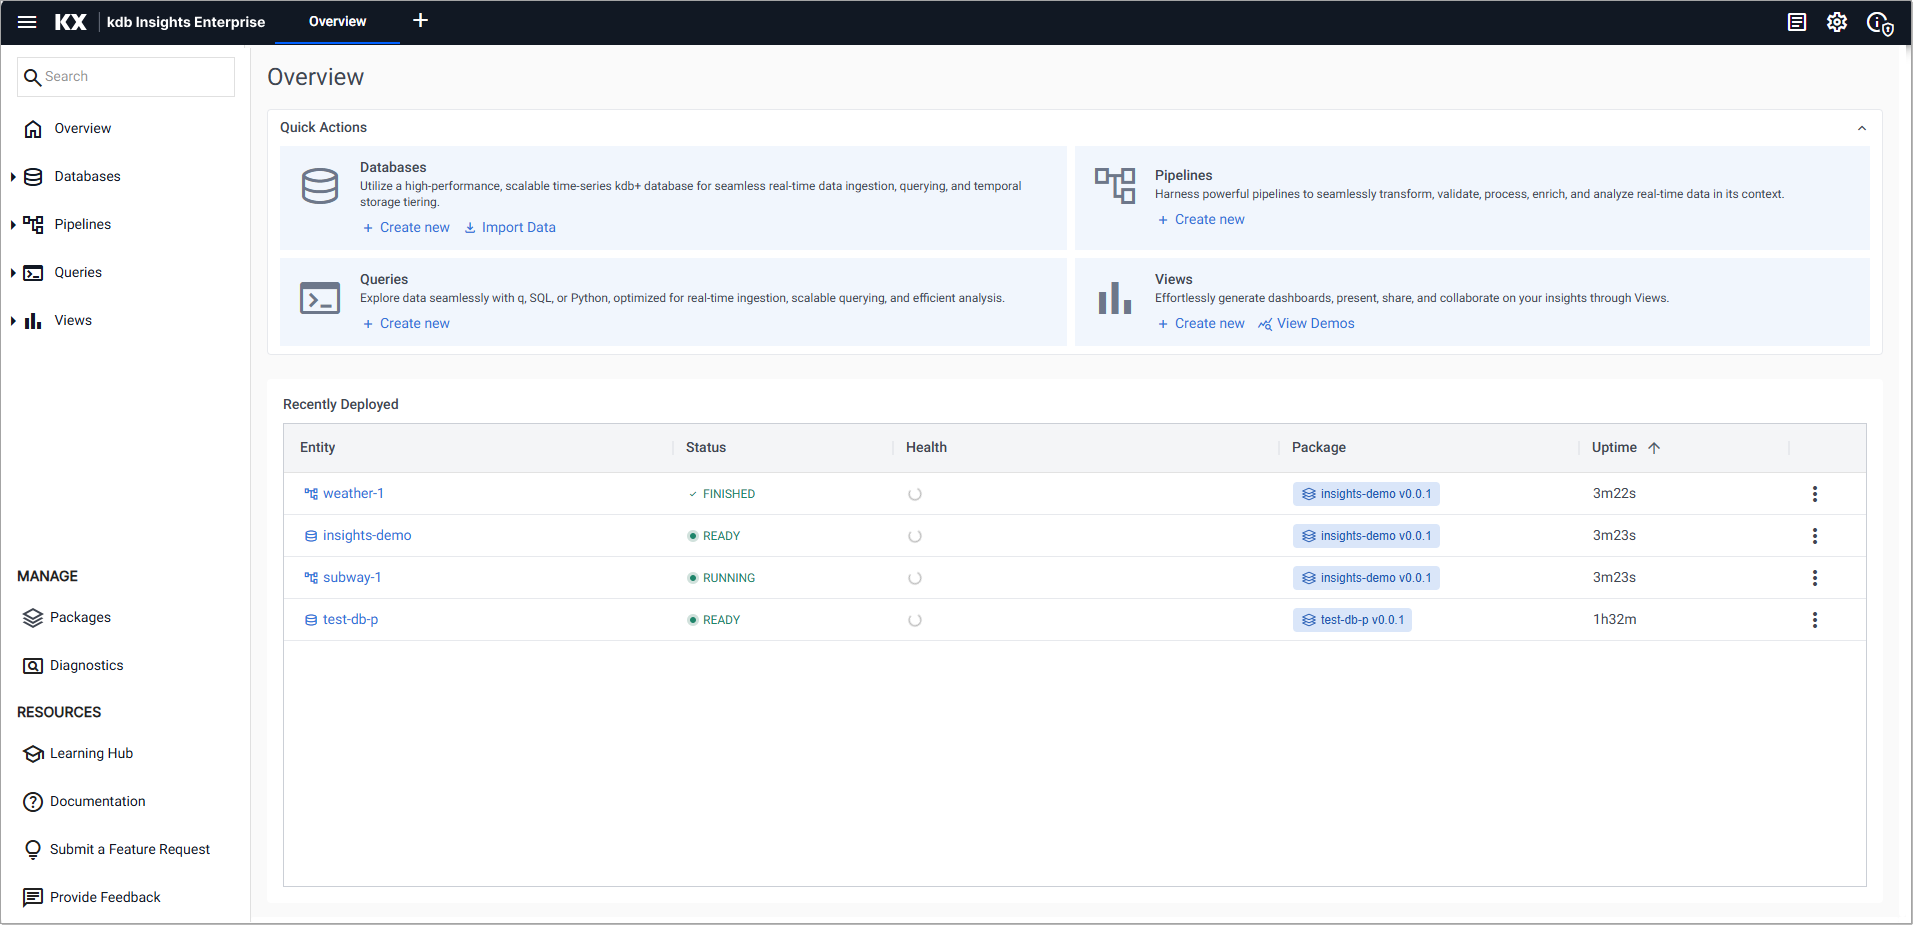
On the Overview page, choose Create new under Pipelines:
-
In the Create Pipeline dialog set the following values:
Setting Value Pipeline Name crimeSelect a Package insights-demoIf
insight-demodoes not appear on the packages list, create it as described in this walkthrough.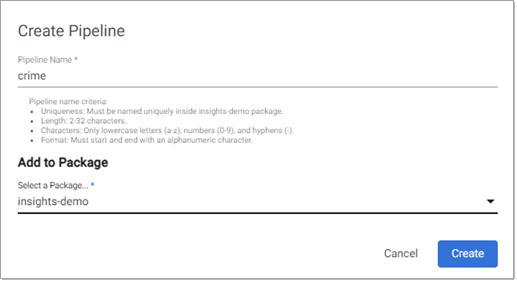
-
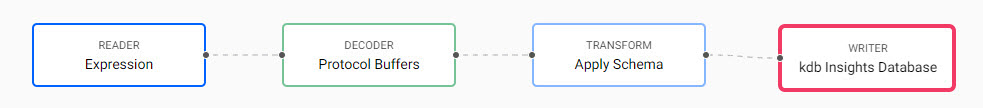
Next, add the nodes to the pipeline, as described in the following sections; Expression node, Decoder node, Transform node, and Writer node:
Add an Expression node
-
Click-and-drag an Expression node from the Readers, into the workspace.
-
Click on the Expression and add the following
qcode to the Configure Expression Node panel. This code pulls in the crime data set.URL:"https://code.kx.com/kxiwalkthrough/data/crime.msg"; resp:.kurl.sync[(URL;`GET;(::))]; if[200 <> first resp; ' last resp]; "\n" vs last resp -
Click Apply to apply these changes to the node.
Add a Decoder node
This node reads in this data in a format compatible with kdb+.
-
Click-and-drag the Protocol Buffers decoder node from the list of Decoders into the central workspace, and connect it to the Expression node.
-
Select the Decoder node.
-
Add the following settings to the right-hand property panel:
Setting Value Message Name crimeMessage Definition copy the JSON code block below As List disabled syntax = "proto3"; message crime { uint64 event_id = 1; string incident_time = 2; uint64 nypd_precinct = 3; string borough = 4; string patrol_borough = 5; uint64 call_x_geo = 6; uint64 call_y_geo = 7; string radio_code = 8; string description = 9; string crime_in_progress = 10; string call_timestamp = 11; string dispatch_timestamp = 12; string arrival_timestamp = 13; string closing_timestamp = 14; double latitude = 15; double longitude = 16; } -
Click Apply to apply these values to the node.
Add a Transform node
This node transforms the crime data fields to kdb+ types compatible with the insights-demo kdb+ database.
-
Click-and-drag the Apply Schema node from the list of Transform nodes and connect it to the Decoder node.
insights-demohas a predefined schema forcrimedata which transforms the data to a kdb+/q format. -
Select the Apply Schema node.
-
In the Configure Apply Schema Node section leave the Data Format setting set to
Any. -
Click the Load Schema icon
 , select the
 insights-demodatabase and thecrimetable from the dropdowns as shown below.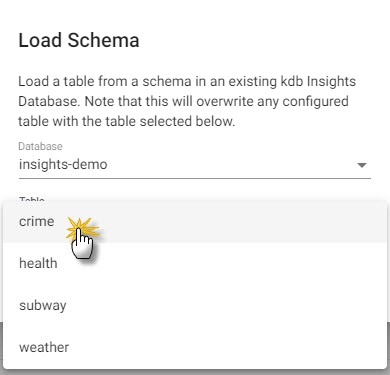
-
Click Load.
-
Click Apply to apply changes to the node.
Add a Writer node
This node writes the transformed crime data to the kdb Insights Enterprise database.
-
Click-and-drag the kdb Insights Database node from the list of Writer nodes into the workspace and connect it to the Transform node.
-
Select the Writer node and add the following settings to the right-hand Configure kdb Insights Database property panel:
Setting Value Database insights-demoTable crimeWrite Direct to HDB No Deduplicate Stream Yes Set Timeout Value No -
Click Apply to apply these settings to the node.
Review the pipeline
The final pipeline looks like this:
Save the pipeline
You now need to save the Pipeline.
- Click Save.
Deploy the pipeline
Deploy the package containing the database and pipeline in order to ingest the data into the database.
- Go to the Package Index page and click on the three dots beside insights-demo package and click Deploy.
Note
It may take Kubernetes several minutes to release the necessary resources to deploy the pipeline.
If the pipeline or database in the package are already deployed you must tear it down. Do this on the Package Index page by clicking on the three dots beside insights-demo package and click Teardown.
-
Check the progress of the pipeline under the Running Pipelines panel of the Overview tab. The data is ready to query when Status = Running.
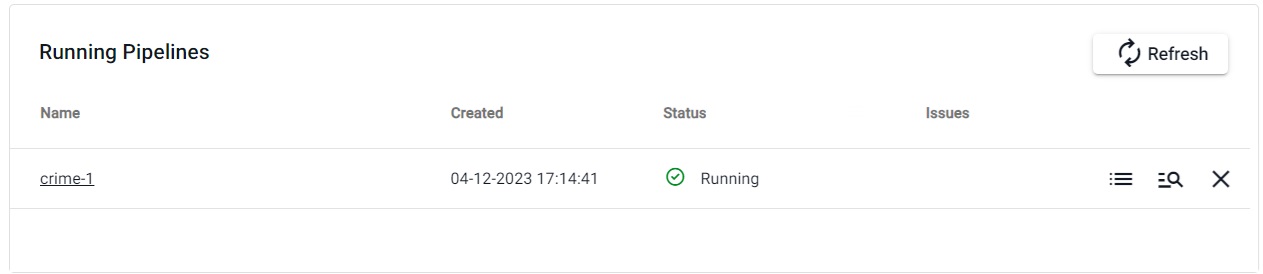
Pipeline warnings
Once the pipeline is running some warnings may be displayed in the Running Pipelines panel of the Overview tab. These are expected and can be ignored.
Next steps
Now that your Pipeline is up and running you can:
Further reading
Use the following links to learn more about: