Create and Configure Pipelines
This page describes how to create and configure pipelines in the kdb Insights Enterprise web interface.
Stream processing involves performing various actions on a continuous flow of data originating from one or more systems. Actions can include a combination of processes, such as:
-
Ingestion: Inserting the data into a downstream database.
-
Transformation: Changing a string into a date.
-
Aggregations: Calculating the sum, mean, or standard deviation.
-
Analytics: Predicting a future event based on data patterns.
-
Enrichment: Combining data with other data, whether historical or streaming, to create context or meaning.
The Pipelines menu, in the web interface, enables you to build and deploy stream processor pipelines to perform these actions.
kdb Insights Stream Processor
Read about the kdb Insights Stream Processor (SP).
This page provides details on the following topics:
-
Index of pipelines: View a list of all pipelines.
-
Pipeline status: Check the status of all your pipelines.
-
Pipelines tab: Learn about the layout of the pipelines tab and how you use it to build pipelines.
-
Building pipelines: Instructions on how to build a pipeline, including links to an example.
-
Pipeline settings: Manage pipeline resources, environment variables and tuning pipeline settings.
-
Deploy, test and save: Guidance on deploying, testing and saving pipelines.
-
Teardown: Stop a running pipeline.
-
Actions: Export, rename, and delete a pipeline.
-
Python code within pipeline UI: Explains the considerations when defining the Python code used for a given node.
Pipelines Index
Click on Pipelines in the left-hand menu to view a list of all your pipelines.
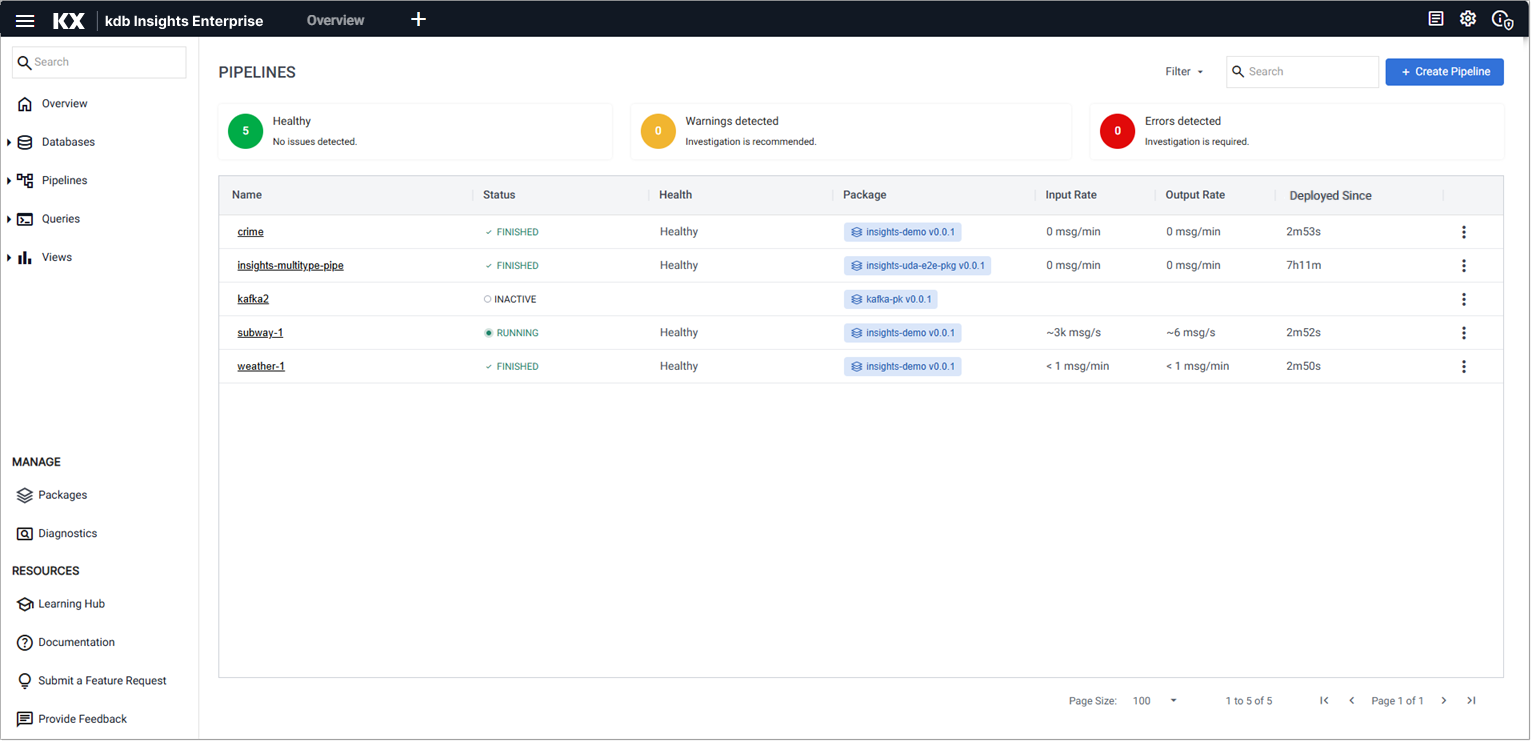
The following details are displayed:
| Item | Description |
|---|---|
| Name | The pipeline name. Click on the name to view details about the pipeline in the pipeline tab. |
| Status | The current status of your pipeline. Hover over the status value for additional information. |
| Health | This column displays the health status of the pipeline. A value of Healthy indicates there are no reported issues with the pipeline and is shown for status of Finished, Running. When an error occurs, a warning message is displayed indicating that attention is required. Refer to warnings and remediation actions for details about these errors and how they can be resolved. |
| Package | The name and version of the package containing this pipeline. |
| Deployed Since | The time since the pipeline was last deployed. |
| Actions | Click the three dots, to the right of the pipeline details, to view a list of pipeline actions. You have options to Export, Rename, and Delete a pipeline. |
Click Create Pipeline to create a new pipeline.
Pipeline status
The status of a pipeline can be checked in two places:
- Pipelines index
- Recently deployed section of the Overview tab.
A pipeline can have one of the following status values:
| Status | Description |
|---|---|
| Creating | Pipeline SP Controller is being created. |
| Initializing controller | Pipeline SP Controller has been created. |
| Partitioning workers | Pipeline is in the process of distributing partitions among one or more Workers. |
| Ready to receive data | Pipeline is ready to start, but is not yet processing messages. |
| Running | Pipeline is running and processing messages. |
| Unresponsive | Pipeline SP Controller is not responding to HTTP requests. |
| Errored | Pipeline errored before starting. This does not include errors encountered while processing messages. |
| Tearing down | Pipeline is in the process of tearing down. |
| Finished | Pipeline has finished processing messages, but has not been torn down. |
| Not Found | Pipeline does not exist. |
Pipeline API status values
If you are using the pipeline APIs such as the details or status API, the statuses are as follows:
CREATINGINITIALIZINGPARTITIONINGREADYRUNNINGUNRESPONSIVEERROREDTEARING_DOWNFINISHEDNOTEXIST
Pipelines tab
-
Use one of the following methods to open the Create Pipeline dialog:
- Click + on the ribbon menu and select Pipeline.
- Click + beside Pipelines on the left-hand menu.
- Click Create Pipeline in the pipelines index.
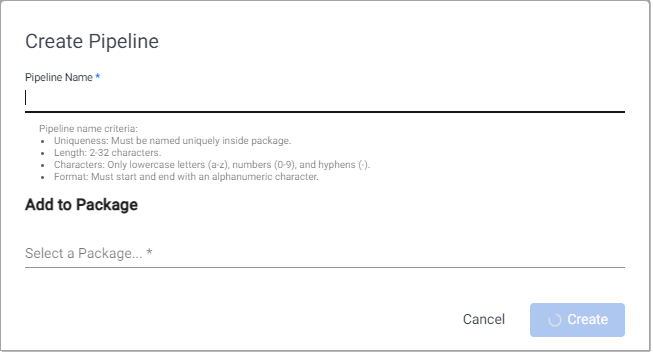
-
Enter a Pipeline Name that is unique within the package, 2-32 characters long, uses lowercase letters, numbers, and hyphens, and starts and ends with an alphanumeric character.
-
Click Select a package under Add to Package, to display a list of packages to which this pipeline can be added. This list includes packages that are currently running.
Click Create new package if you want to add the pipeline to a new package. Enter a unique package name that is 2-32 characters long, uses lowercase letters, numbers, and hyphens, and starts and ends with an alphanumeric character.
See packages for further details about packages.
-
Click Create.
The Pipeline tab opens, as shown below.
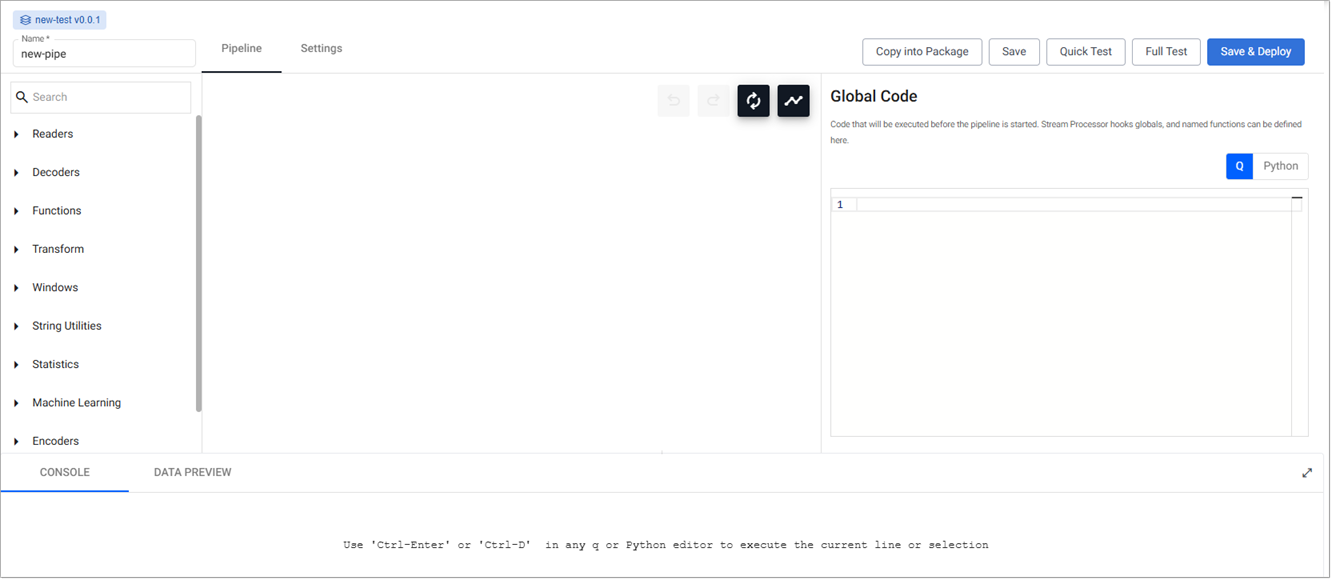
From here you can build a pipeline, with additional settings available on the Settings tab.
Nodes and Operators
The terms operators and nodes are used interchangeably within this document and within the user interface.
The Pipeline tab has a number of elements, described in the following table.
| Section | Description | ||||||||||||||
|---|---|---|---|---|---|---|---|---|---|---|---|---|---|---|---|
| Package details | The top left-hand corner of the tab has the package name and version. This is the package containing this pipeline. Click on the package name to open the Package Entities dialog box that displays all the entities; database(s), pipeline(s), and view(s) this package contains. | ||||||||||||||
| Name | The pipeline name is displayed in the top left-hand corner of the screen. A default name is applied when the pipeline is created. You can change this. The name you set must be lowercase, only include letters and numbers, and exclude special characters other than hyphen (-). | ||||||||||||||
| Operators menu | The left-hand panel shows a search box and list of operators. Operators are the building blocks for pipelines. Each operator is capable of operating on data in a stream but each has a specific function. There are different types of operators used to perform different functions. | ||||||||||||||
| Pipeline builder | The pipeline builder area is in the center of the screen. You build pipelines by adding operators to the workspace and joining them with the operator-anchors. Operators can be removed on a right-click, or added by click-and-drag from the entity tree, or a right-click in an empty part of the workspace. To change a connection, roll over to display the move icon and drag-connect. Remove connections with a right-click on the connection you want to delete. |
||||||||||||||
| Graphic options | The pipeline builder contains a number of options you can use when working with pipelines.
|
||||||||||||||
| Global Code | When no operator is selected, the right-hand panel contains the Global Code configuration. Global Code is executed before a pipeline is started. This code may be necessary for Stream Processor hooks, global variables, and named functions. | ||||||||||||||
| Operator Configuration | When an operator is selected, the right-hand panel contains the configuration details for the selected operator. For example, the following screenshot shows the configuration for the Kafka operator. 
| ||||||||||||||
| Advanced Operator Configuration | Some operators support additional advanced configuration that can be accessed by clicking the gear icon in the top right corner of the operator configuration panel. For example, the Map operator has advanced configuration options, as shown here.  Nodes that don't support this feature do not have the gear icon present. Refer to the q API for more details about advanced operator configuration. | ||||||||||||||
| Actions | When an operator is added, the right-click menu has a number of actions that can be performed on the operator, such as Rename, Remove, and Duplicate. To undo any of these actions, click Undo. 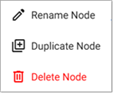
| ||||||||||||||
| Console | All q or Python editors in the Operator Configuration sections are executable and can be used to interactively develop complex functions. The current selection or line can be executed using 'Ctrl-Enter' or '⌘Enter' and the output viewed in the Console tab in the bottom section of the pipeline tab. | ||||||||||||||
| Data Preview | Results of test deploys are displayed in the Data Preview tab in the lower panel of the pipeline tab.Click on an operator to see the results at each step along the pipeline. |


Building a pipeline
To build pipelines, start by adding and connecting operators within the pipeline builder. At a minimum, for a pipeline to produce any output, it requires a reader and a writer operator. However, when building or debugging a complex pipeline, it can be useful to start with just a reader and test/deploy the pipeline iteratively as additional nodes are added.
This section provides step-by-step instructions. For an example see the Protocol Buffers walkthrough.
Import Wizard
It is also possible to create a pipeline, in the Web Interface, using the Import Wizard, which guides you through the process of creating the pipeline.
Database selection
If a database hasn’t been created yet, create the database before proceeding with pipeline configuration. The initial database setup includes a default table and schema, and you can add more tables to the database schema as needed.
-
Open the pipelines tab and click and add nodes to the pipeline builder.
- Add nodes by clicking and dragging them from the menu of operators on the left.
- Delete nodes by right-clicking on the node and selecting Delete Node.
- Join nodes using the operator-anchors. Click and drag an anchor on one operator to the anchor on another operator.
- To change a connection, rollover to display the move icon and drag-connect, remove with a right-click.
- Click a node to configure it using the configuration section on the right.
You can select from the following types of operators:
-
Readers read data from an external or internal data source.
-
Writers send data to an internal or external data sink.
-
Functions provide building blocks for transforming data by mapping, filtering or merging streams.
-
Encoders map data to serialize data formats that can be shared out of the system with writers.
-
Decoders deserialize incoming data into a kdb+ representation for manipulation.
-
Windows group data into time blocks for aggregating streams.
-
String Utilities perform string operations on data.
-
Transform operators provide low code and no code transformations for manipulating data.
-
Machine Learning operators can be used to build prediction models of data in a stream.
-
Nodes that contain a main function, such as Apply and Map nodes, support customization of the parameters that are passed into that function. See main function parameters for further details.
-
Configure each of the pipeline operators. Click on the node to display operator parameters in the panel on the right. The following screenshot shows the operator parameters for a Kafka node.
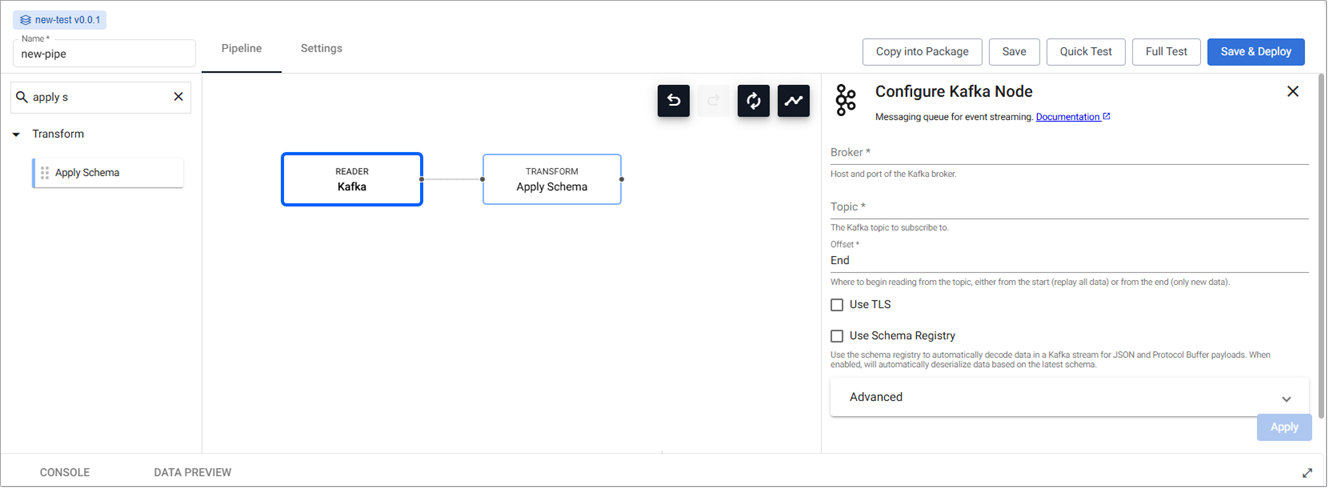
Certain fields are required and you cannot save or deploy the pipeline without setting these field values.
Development of stream processor pipelines within the UI allows for logic to be written in Python. See python code in pipelines for details.
-
Rename the pipeline by typing a new name in the name field in the top left corner.
-
Click Save to save the pipeline configuration.
-
It is advisable to test your pipeline before deploying it. See test deploy for details.
-
Ensure the database associated with this pipeline is deployed. A pipeline can be associated with a database prior to deployment, or deployed directly to an active database. See deploying the database for details.
-
When you are satisfied with your pipeline, deploy it by clicking Save & Deploy.
Once it's running, it shows in the list of running entities in the Recently Deployed section, on the Overview page, and is added to the list of pipelines on the Pipelines index.
A running pipeline can then be queried. See query data for details.
Kafka & Postgres Setup
When using Kafka and Postgres pipelines, relevant charts must be installed, running, and accessible on the cluster.
Lower Case required
When configuring pipelines, lower case must be used in all instances of names and references.
Customizing Main Function Parameters
Nodes that contain a main function also support customizing the parameters that are passed into that function. For most nodes, only the data from the previous node is passed into the main function as the only parameter. However, metadata and the operator definition can also be passed into the function if desired. This can be helpful when needing to action based on the data's metadata, or if needing to use Stream Processor functions like .qsp.set and .qsp.get. This works for both q and Python functions.
Changing the parameters
After changing these settings you must update your function to accept the new parameters and make use of them.
Main function
The 'main function' is the function defined at the top of the node configuration form. Some examples of nodes that use a 'main function' and have customizable parameters are the Apply and Map nodes. These parameter settings only apply to the main function field. Any subsequent functions defined after the main function are not affected by these settings.
Copy pipeline into Package
You can copy a pipeline into another package.
-
Click Copy into Package top open the Copy Pipeline into Package dialog.

-
The Pipeline Name is auto-filled with
pipeline-name-copy. Change the name if required. - Click Select a Package under Add a Package. Either select an existing package, to add this copy of the pipeline to, or click Create new package to add the pipeline copy to a new package.
-
Click Create. The pipeline (including settings and nodes) is created in the selected or newly created package.
The copied pipeline is opened.
Save, Test, Deploy and Teardown
Save
In the pipeline tab click Save to save the pipeline. A pipeline must be deployed to ingest data.
Test pipeline
Test deploys allow you to validate pipeline output without writing data from writer nodes. They also enable interactive debugging of running pipelines and allow you to control when the test stops, which is useful when data arrives intermittently.
To run a test, deploy the pipeline in the scratchpad to validate that it works. Refer to Test Deploy for details.
Full test (legacy)
A full test deploy runs the pipeline using worker and controller pods to validate that it works in a fully deployed environment. This test takes longer because it deploys the pipeline as a full deployment and does not allow interactive debugging.
This method is deprecated in favour of the default test. It was originally introduced to support pipelines that were not compatible with the scratchpad-based test API.
Refer to Test Deploy for more information.
Deploy
It's recommended to test deploy your pipelines before performing a full deployment.
Warning
If entitlements are enabled, but you don’t have entitlements to a database, any pipeline you deploy that tries to read from that database will fail.
Before deploying a pipeline, ensure you have entitlements to all the databases that pipeline needs to access, especially if you're using a Database Reader.
To deploy your pipeline, click Save & Deploy. The pipeline initializes and starts running.
-
See pipeline status for details on how to check if your pipeline has deployed successfully.
-
Deployed pipelines are deployed indefinitely.
-
If a deployed pipeline errors, it remains deployed.
-
To stop a running pipeline tear it down
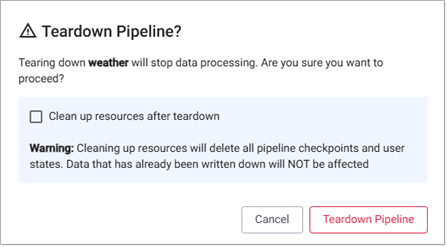
Teardown
Tearing down a pipeline stops data processing.
-
Click Teardown on the pipeline tab.
-
If you want to delete all pipeline checkpoints and user states, tick the Clean up resources after teardown check box before you click Teardown Pipeline.
-
Click Teardown Pipeline to stop data processing.
The status of the pipeline is updated to Inactive as soon as the teardown is complete.
Pipeline Actions
The pipeline actions menu can be accessed by:
-
Clicking the three dots to the right of the pipeline details in the Pipeline index.
-
Opening the Pipelines drop-down on the left-hand menu and clicking the three dots beside the pipeline name.
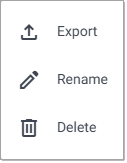
The following shows the actions for an active pipeline.

Export a pipeline
To export a pipeline as a .yaml file:
-
Click Export in the pipeline actions menu.
A
.yamlfile is created with the name of the exported pipeline.
Rename a pipeline
To rename a pipeline:
-
Click Rename in the pipeline actions menu.
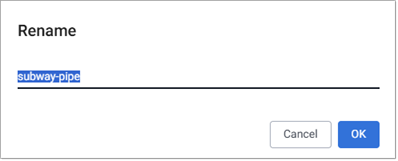
-
Replace the current name with the new name.
-
Click OK.
The pipeline is renamed.
Delete a pipeline
To delete a pipeline:
-
Click Delete in the pipeline actions menu.
 -
Click Delete to confirm you want to proceed.
The pipeline is deleted.
Python code within pipeline web interface
Development of stream processor pipelines within the web interface allows for logic to be written in Python. The following sections outline the requirements and caveats that you should bear in mind when developing such nodes.
Writing Python code within the pipeline web interface
When defining the code which is to be used for a given node you need to take the following into account:
- The parsing logic used to determine the function used within a Python node works by retrieving for use the first function defined within the code block. The entire code block will be evaluated but it is assumed that the first function defined is that is retrieved is that used in execution.
- Only Python functions are currently supported for definition of the execution function logic. You should not attempt to use
lambdasor functions within classes to define the execution logic for a node. Additionally, while functions/variables defined within the global code block can be used within individual nodes, they cannot be referenced by name as the definition of the function to be used. - All data entering and exiting an executed Python node block receives and emits its data as a
PyKXobject. The PyKX documentation outlines how these objects can be converted to common Python types and, additionally, includes notes on performance considerations that should be accounted for when developing code that interacts with PyKX objects.
The following provides an example of a map and filter node logic which could be used on a pipeline:
import pykx as kx

def map_func(data):
    # compute a three-window moving average for a table
    return kx.q.mavg(3, data)
    # Function expected to return a list of booleans
    # denoting the positions within the data which are to
    # be passed to the next node
def filter_func(data):
        return kx.q.like(data[0], b"trades")
Next steps
- Read more about pipeline operators
- Configure pipeline settings
- Test pipeline configuration
- Troubleshoot pipelines