Navigate the Web Interface
kdb Insights Enterprise has both a web interface and a command line interface. This page introduces you to the web interface, its features and functionality
The web interface, described in this section, enables you to manage databases and pipelines to ingest and store data, and to query and visualize that data.
Web Interface introduction
After you login to the kdb Insights Enterprise web interface, you are presented with the Overview page.
The web interface includes the following elements:
- Left-hand menu
- Ribbon menu
- Quick Actions and Recently Deployed panels
Keyboard navigation
Menu items can be navigated using the keyboard:
-
Tab key to navigate to interactive elements
-
Enter to select
-
Esc to close menus.
-
Tab moves focus between interactive items, the arrow keys let you cycle through elements that the screen reader can read aloud.
Roles
Access to features in the kdb Insights Enterprise web interface is controlled by user roles. You can only use the features assigned to your specific role. If you can't see certain functionalities mentioned in this documentation, please contact your system administrator.
For example, a user with the insights.role.viewer.dashboard global role can only see views they're entitled to and cannot see/access any other artifacts (databases, tables, pipelines, packages).
For more information, refer to Web interface overview for Views-only users.
Supported browsers
The kdb Insights Enterprise web interface runs on the latest version of Chrome, Safari, Edge, and Firefox. We recommend that you use Chrome.
Left-hand menu
The following table describes the left-hand menu options and provides links to the functionality they support.
| Icon | Description |
|---|---|
Search |
Perform a search to quickly locate entities in the left-hand panel. |
Overview |
Return to the Overview page. |
Databases |
Displays a list of available databases. From here you can create, deploy, export or delete a database. |
Pipelines |
Build, export, edit folders and tags, rename or delete a pipeline. |
Queries |
Create, rename or delete a query. |
Views |
Create, share, rename, edit folders and tags, or delete a view. |
| MANAGE | |
Packages |
Manage packages. |
Diagnostics |
Troubleshoot pipeline and database errors with diagnostics. |
| RESOURCES | |
Learning Hub |
Access the KX learning hub. |
Documentation |
Read the KX product documentation. |
Submit a Feature Request |
Access the KX Feature Request Portal. |
Provide Feedback |
Submit your feedback on your experience with this product. |
Additional Actions
When you expand the menu on any of the left-hand menu items and hover over the entities listed you can see three dots to the right of the entity name indicating there are more actions available.
Click on the three dots to see the following:
Ribbon menu
The ribbon menu runs across the top of all web interface screens.
Click + to open a menu of items for databases, pipelines, queries, and views.
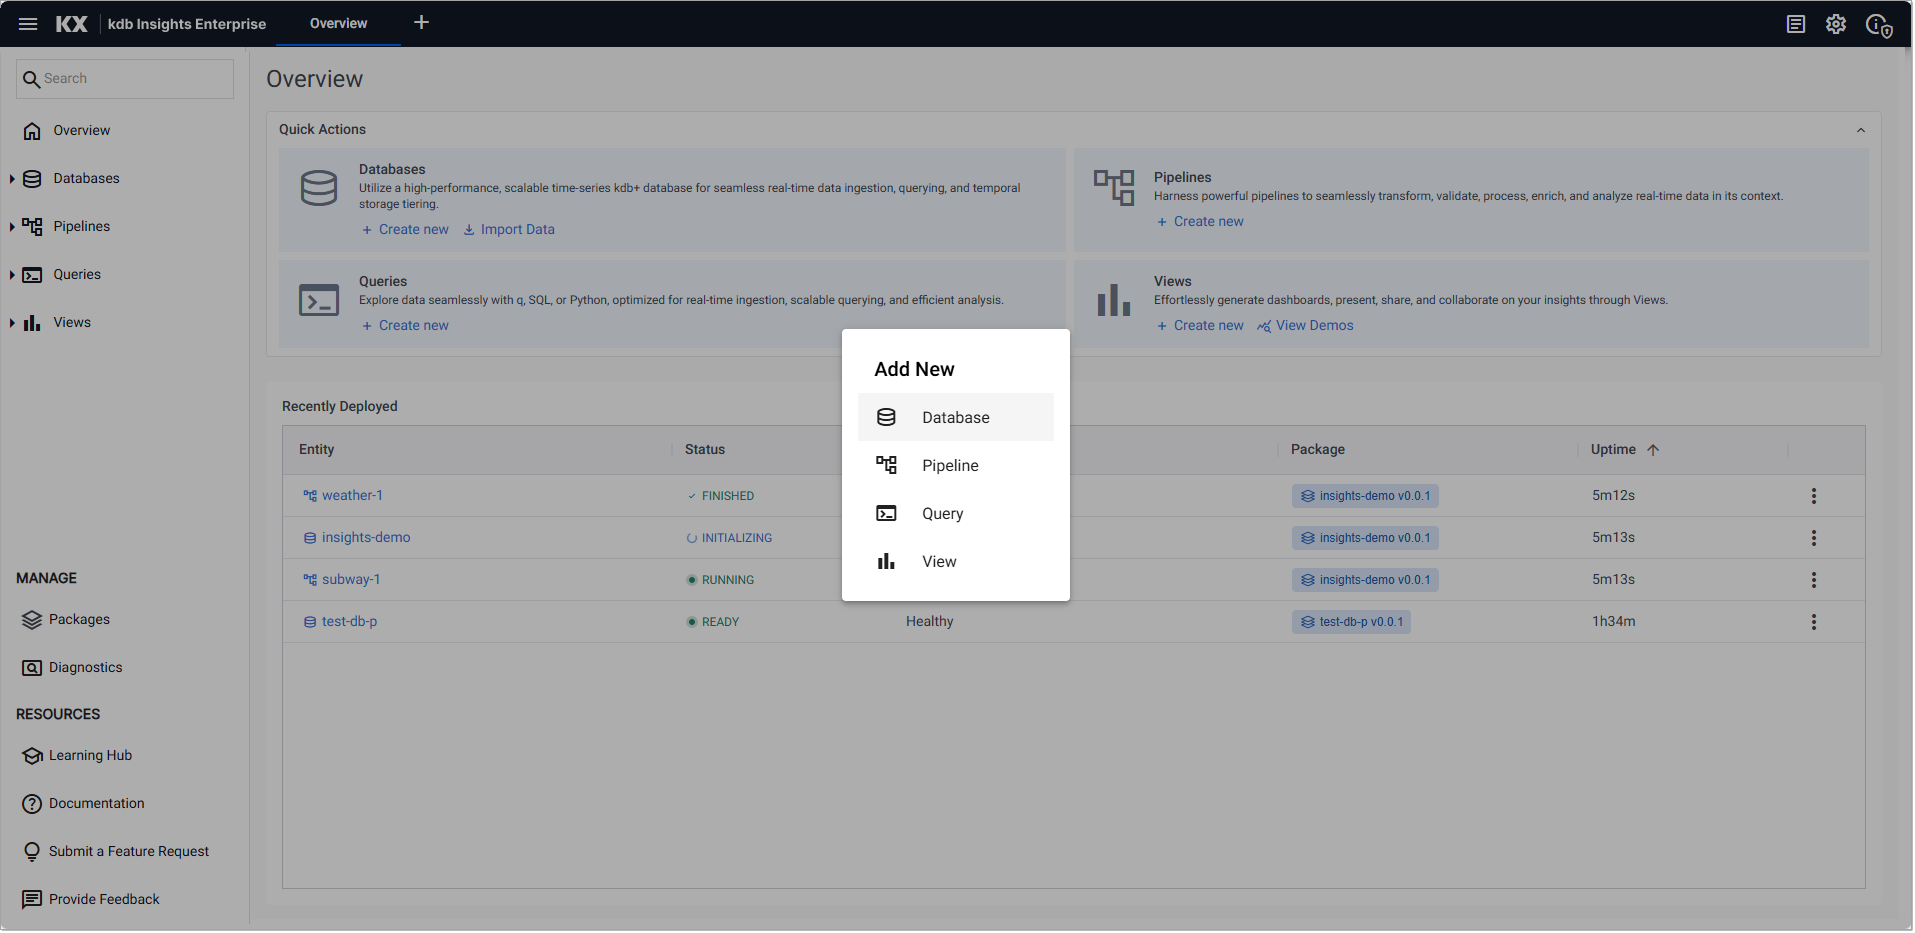
The right-hand side of the ribbon menu contains the icons described in the next section.
Ribbon menu icons
The ribbon menu contains the following icons:
| Item | Description |
|---|---|
 System Notifications |
Click the System Notifications icon to display a log of system errors and information messages. Click  for a full-page view. for a full-page view. |
 System Information |
Click the System Information icon to display: the kdb Insights Enterprise version and license information, and the status of encryption of data in transit. |
User Profile |
Click the user profile button to display the name of the currently logged in user and access the option to logout. |
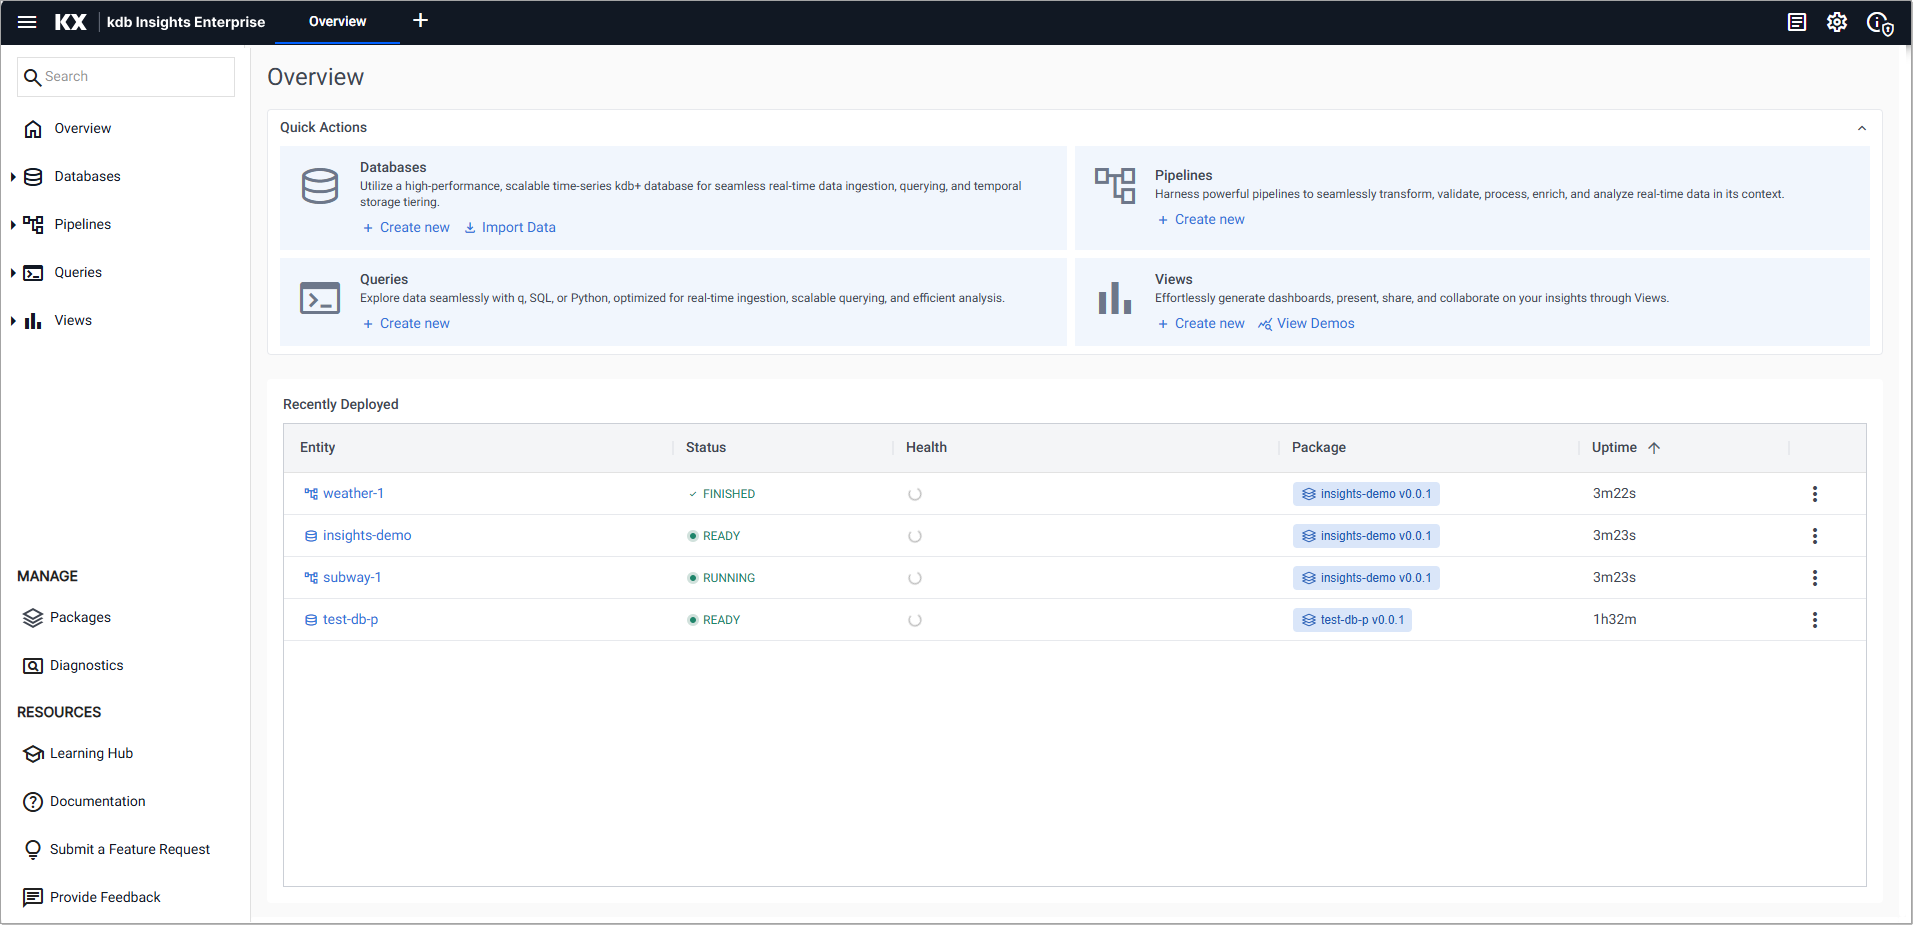
Overview
The Overview page is the home page for the kdb Insights Enterprise web interface.
On the Overview page you see two main sections:
Quick actions
The Overview page contains the following actions that allow you to build, import, query and visualize data.
| Entity | Actions |
|---|---|
| Databases | Build databases and schemas. Import Data using the import wizard to bring data into the system. |
| Pipelines | Build pipelines to ingest data into your databases. |
| Queries | Build queries to explore your data using q, SQL, or python. |
| Views | Build views to present and share your insights using views. View Demos which illustrate the power and versatility of the Views in kdb Insights Enterprise. |
Recently Deployed
The lower section of the Overview page displays a table the provides detailed information about the most recently deployed databases and pipelines. A maximum of 15 rows is displayed.
| Column Name | Description |
|---|---|
| Entity | The name of the deployed database or pipeline. For a complete list of all databases and pipelines on your environment, in addition to those that are deployed, go to the database index or pipeline index. |
| Status | The status of the database or pipeline. For details see: - Database status values - Pipeline status values Hover over the status value to display additional information. For example if an ERRORED status is displayed, hovering over the status displays details of the error. |
| Health | This column displays the health status of the database or pipeline. A value of Healthy indicates there are no reported issues. A warning message is displayed when attention is required. Refer to warnings and remediation actions for details about these errors and how they can be resolved. |
| Package | This is the name of the package that includes this database or pipeline. Click on the name to open the Package Entities dialog. See Packages for further details about packages. |
| Deployed Since | The time since the database or pipeline was last deployed. |
| Actions | Click the three dots in the last column to view a list of database or pipeline actions. See - Database actions - Pipeline actions |
Web interface features
Supported browsers
The kdb Insights Enterprise web interface runs on the latest version of Chrome, Safari, Edge, and Firefox. We recommend that you use Chrome.
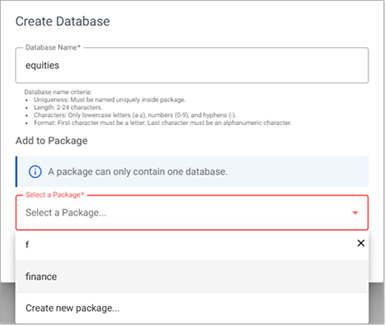
Search dropdown selection
Dropdown selectors, such as those used when creating an entity, feature a search option that streamlines selection and improves usability.
In searchable dropdowns like Select a Package, shown below, begin typing in the input field to filter the list of available options. You can:
- Use arrow keys or scroll bar to navigate the filtered list.
- Press Enter or click to select an item.
-
Continue typing to refine the search or enter the full name directly.
Further reading
- Create & manage databases to store data
- Create & manage pipelines to ingest data
- Create & manage queries to interrogate data
- Create & manage views to visualize data