Access performance monitoring data
This page describes how to access your KX Sensors performance monitoring data.
You can access your performance monitoring data in two ways:
- Through the KXS Monitor Dashboard.
- Through the
getMonStatsAPI.
Use the KXS Monitor Dashboard
There are seven performance monitoring tabs on the KXS Monitor Dashboard:
- Feed shows live state of data loaders (DLs) as well as the feed table
- System shows current state of core KXS processes
- Today shows all records for all processes/services within the monitoring class selected since the last End of Day (EOD)
- Server Health shows server statistics including CPU and memory
- Log shows a graphical interpretation of log monitoring table
- Alert shows a graphical interpretation of alerts monitoring table
- IPC shows live and historical IPC traffic
Each process/service is assigned a state to indicate its status. Some of the more common states are:
| State | Description |
|---|---|
| active | the process/service is operating normally |
| busy | the process/service is operating normally but currently busy |
| non-responsive | the process/service has not reported monitoring statistics for some time, thus indicating a possible problem |
| inactive | the process/service has either been shut down or has terminated unexpectedly |
By convention, the Dashboard port number is at offset 11 of the port range for the server. In your browser, enter the following address:
http://<installed host>:<configured base port+11>
To view the data:
- Click on the appropriate tab: System or Today.
- Select the monitoring table that you wish to look up from the Table dropdown list.
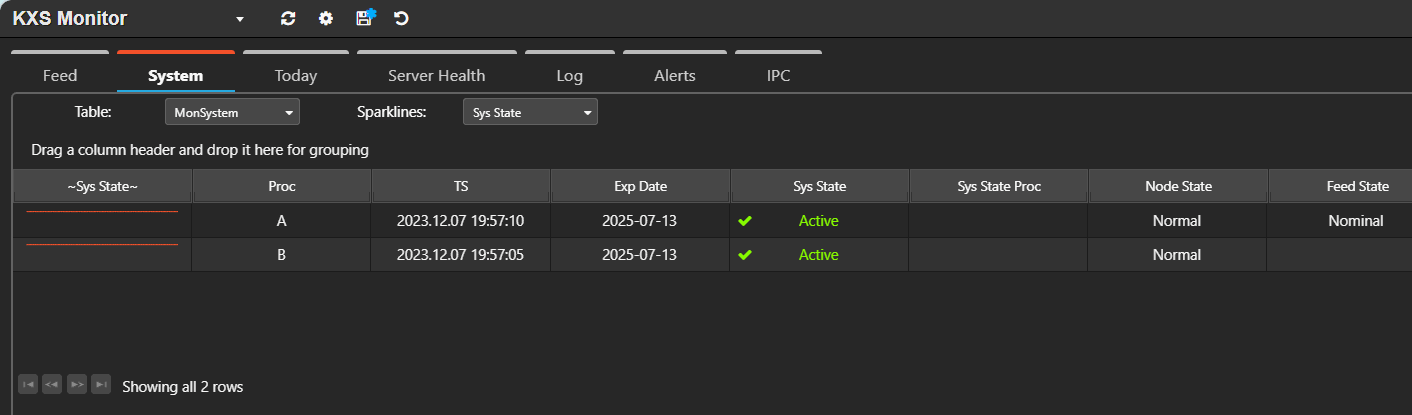
KXS Monitor supports the grouping, ungrouping and suppression of columns, the rearranging of their sequence and the filtering of records. You can also download the data in CSV format and create sparklines (a visual representation of the data).