Overview of watches and alerts
This page introduces watches and alerts in KX Sensors, and explains how statistical and log watches trigger notifications to the Monitor Dashboard or an HTTP destination.
You can establish watches to monitor log messages (for example, to increase visibility of warnings and errors), and to capture threshold violations on any statistic reported to the KXS Monitor Dashboard. Some examples of possible candidates for watches are inactive or non-responsive processes, excessive memory usage by a process, and uneven SDL activity. Any watch can have an associated alert action that surfaces the event to an HTTP destination. HA-related alerts (such as failover and failback events) are also supported.
Statistical watches are triggered when a value crosses a configured threshold. They are repeated if the severity of the condition or state worsens or if it improves (for example, if a warning message becomes a critical message or is restored to nominal). You can base the value of the statistic on an instantaneous sample or the maximum or minimum value of a series of samples taken over a period of time.
For example, given a warning threshold of 150,000 and a critical threshold of 2,000,000 for memory usage:
| Sequence | Current memory usage | Description | Watch triggered |
|---|---|---|---|
| 1 | 125,000 | Memory usage is below warning threshold | No |
| 2 | 155,000 | Warning threshold breached for first time | Yes |
| 3 | 155,000 | Memory usage unchanged | No |
| 4 | 500,000 | Memory usage increases | No |
| 5 | 2,100,000 | Critical threshold breached for first time | Yes |
| 6 | 1,000,000 | Usage drops back to warning threshold | Yes |
| 7 | 125,000 | Usage drops below warning threshold | Yes |
| 8 | 150,000 | Usage increases but remains below warning threshold | No |
| 9 | 175,000 | Warning threshold breached for second time | Yes |
Watch events are published to the MonAlert table and are accessible through the KXS Monitor Dashboard as well as the getMonStats API.
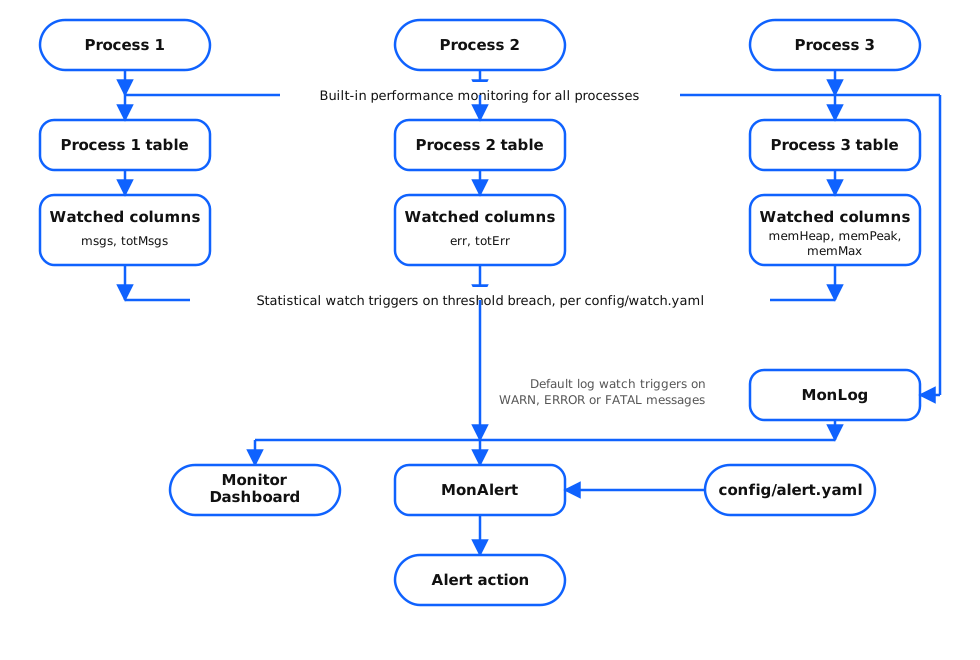
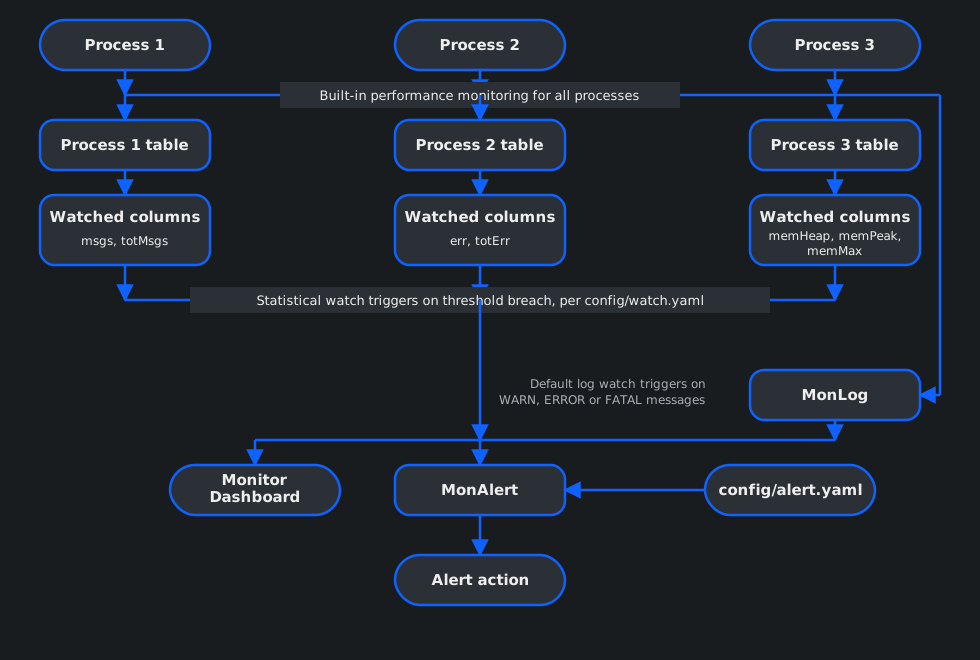
Default watches
KX Sensors includes a default log watch that triggers whenever a process encounters a WARN, ERROR or FATAL message. These watches are automatically published to the MonLog table (and are therefore accessible from the Dashboard display), but by default do not have any alert-related actions defined for them.
Directory structure for watches and alerts
Watch and alert YAML files are treated like any other configuration object in KX Sensors. Lower-level watch and alert files (for example, files at the kxs-core level) are defined as defaults, which you can override at higher levels such as your customer- or environment-specific packages.