Diagnostics
This page aims to help you access diagnostics logs, to locate errors encountered during the deployment of a database or pipeline.
Diagnostic Access
Open diagnostics from the left-hand menu to view logs of a pipeline or database deployment.
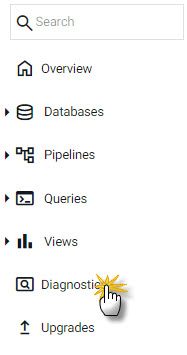
Access Diagnostics from the left-hand icon menu.
1. Select a Pipeline or Database
Choose from the dropdown menu the pipeline or database to investigate.
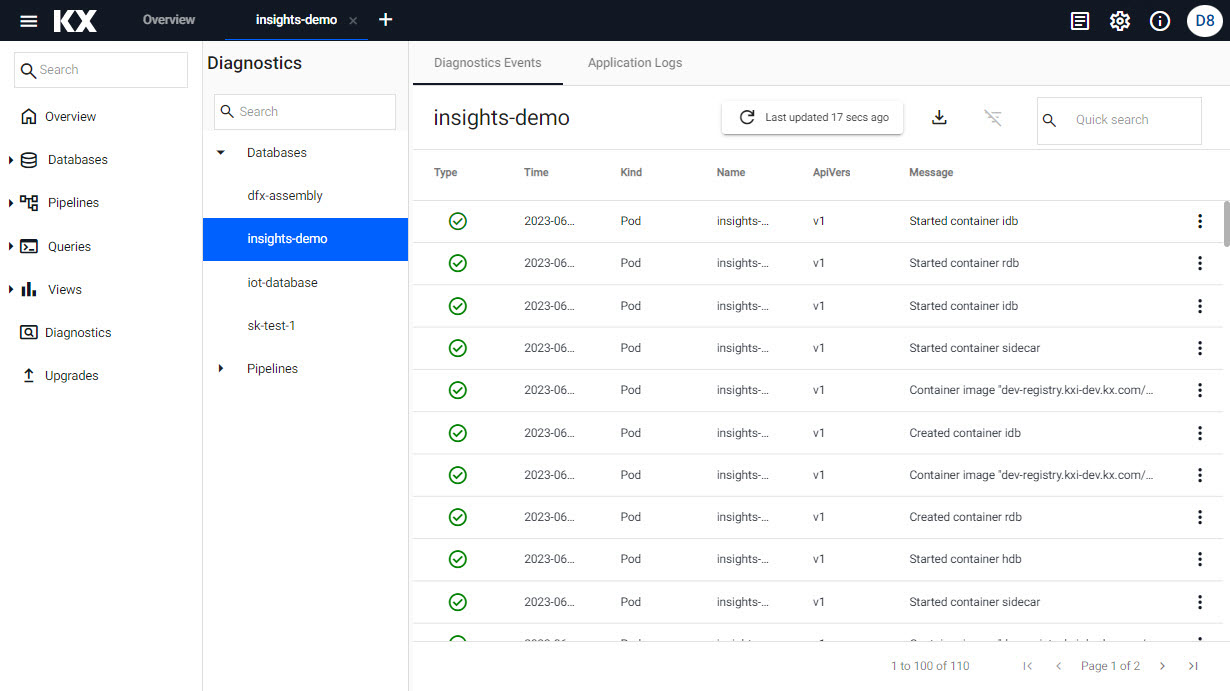
Selecting a pipeline shows the Diagnostic Events and Application Logs for the deployment.
2. View Application Logs
The application logs show errors during deployment; filter by Fatal, Error or Warnings by checking the appropriate box. Text searches are also supported.
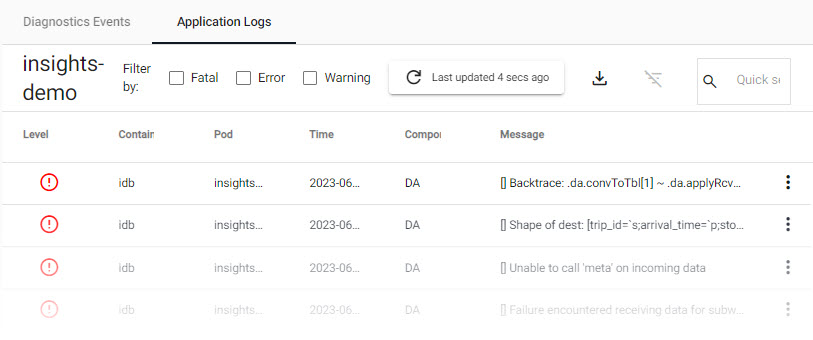
Application logs of reported errors during deployment.
Logs can be downloaded by clicking 
3. View Diagnostic Events
A record of deployment events for the pipeline or database include successful events (green tick) or warnings (yellow triangle).
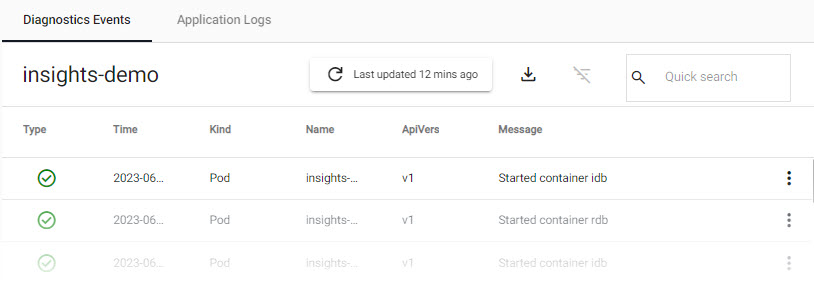
Processed events of a pipeline deployment.
Additional filtering is available from the column headers:
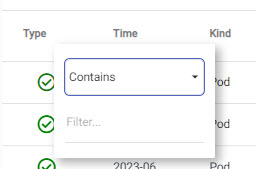
Text search filter events.
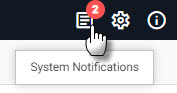
4. View System Notifications
Click the System Notifications icon to view the status of kdb Insights Enterprise
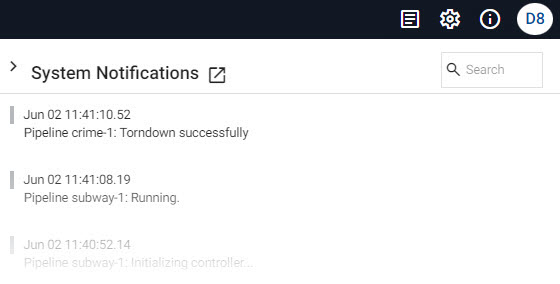
Click the system notifications icon in the ribbon menu to view real-time notifications of the current kdb Insights Enterprise session.
A slider panel lists the system events, as illustrated below.
Further Reading
- [Learn more about kdb Insights Enterprise diagnostics.](../troubleshooting/