Quick Debugger
The Quick Debugger shows a non-interactive backtrace when run on an expression that throws an uncaught error. It loads straight to where the error occurs. The values shown for the variables are their values at the time of the error. The current position of execution is indicated in each frame by a blue arrow.
At the end of the last frame, the error, erroring operation, and arguments are given.
An Interactive Debugger is provided within KX Platform installations of KX Analyst. See the product comparison for more information about the product differences.
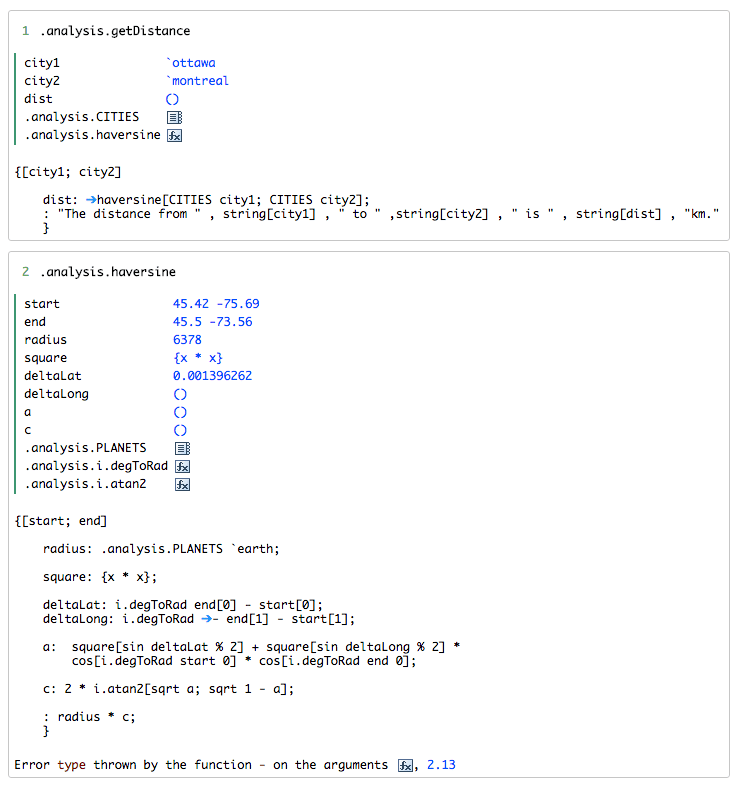
If the value is too long to display inline, an icon depicting the type of the variable will be displayed instead. Clicking this will show the value in the console.
If you debug an expression that throws an error explicitly, or errors while not in a function, such as .myLib.plot 100f?1f, you will get an error message like this

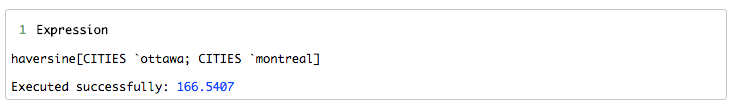
If there are no errors, the return value will be shown
Peach
Errors occurring inside a peach can only be reported when running with no secondary threads. There may be other causes for this error message besides errors inside a peach.
