Protocol Buffers (Crime)
No kdb+ knowledge required
This example assumes no prior experience with q/kdb+ and you can replace the endpoints provided with any other Protocol Buffer endpoint to gain similar results.
Protocol buffers are Google's language-neutral, platform-neutral, extensible mechanism for serializing structured data – think XML, but smaller, faster, and simpler. Data structure is first defined before specially generated source code read-and-writes structured data, to-and-from a variety of data streams, using a variety of programming languages.
The crime data set we will be using contains events occurring in NYC, organized by precinct, including location coordinates of the call, dispatch times and a description of the crime.
I want to learn more on how protocol buffers work with Kx Insights Platform
I want to learn more about Protocol Buffers
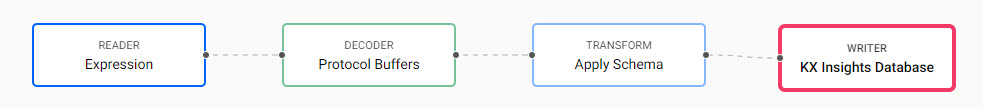
Pipeline Editor
In this example we will not use the Import Wizard to ingest the data, but instead build a pipeline using the pipeline editor.
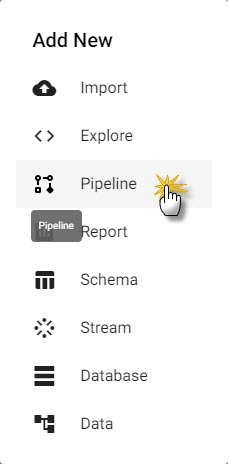
Start by creating a new pipeline; click the [+] icon in the document menu bar and select Pipeline, or select [+] from Pipelines in the entity tree menu on the left while in Overview. This will open a new tab in the Document bar with a draft pipeline
The draft pipeline editor will start with a list of Readers in the left-hand-menu; click-and-drag the Expression node into the central workspace.
Expression Node
Clicking the Expression node will update the properties of the node on the right. The Expression node is a kdb/q editor, here code will be added to take advantage of native REST interfacing functionality (an API supporting interaction with RESTful web services) in the KX Insights Platform using .kurl.sync. This step will require a cut-and-paste of some kdb+/q code:
URL:"https://code.kx.com/kxiwalkthrough/data/crime.msg";
resp:.kurl.sync[(URL;`GET;(::))];
if[200 <> first resp; ' last resp];
"\n" vs last resp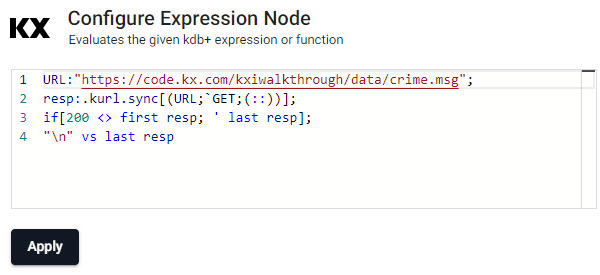
Decoder
The output from aforementioned code will resemble a binary format.
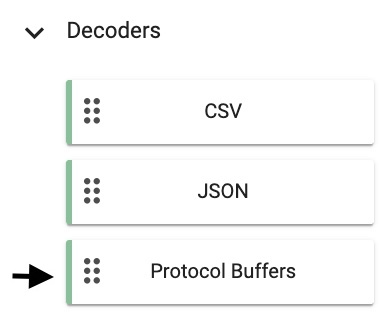
The next step will convert the binary format to kdb+/q. To achieve this, drag and drop the Protocol Buffers node from Decoders.
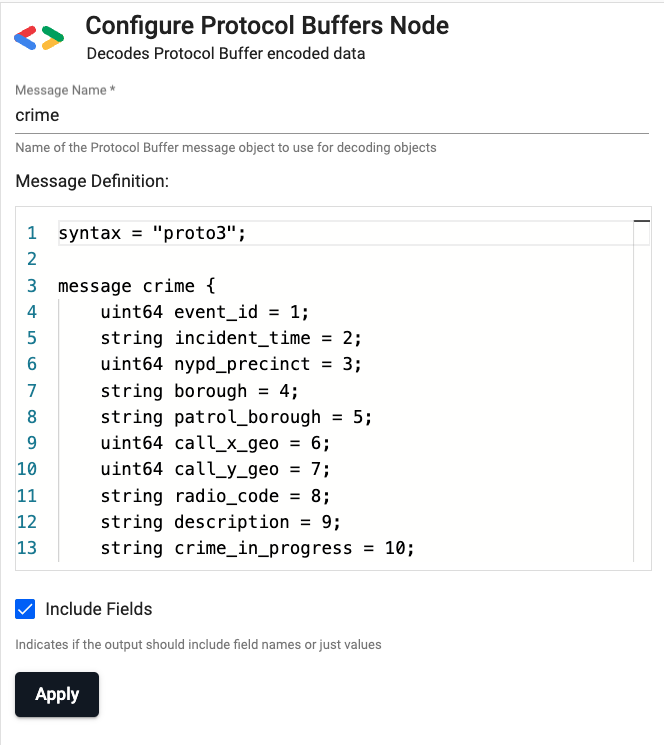
In order to decode the message from binary to kdb+ two values must be supplied in the Decoder node:
1) Message Name: crime
2) Message Definition:
syntax = "proto3";

message crime {
    uint64 event_id = 1;
    string incident_time = 2;
    uint64 nypd_precinct = 3;
    string borough = 4;
    string patrol_borough = 5;
    uint64 call_x_geo = 6;
    uint64 call_y_geo = 7;
    string radio_code = 8;
    string description = 9;
    string crime_in_progress = 10;
    string call_timestamp = 11;
    string dispatch_timestamp = 12;
    string arrival_timestamp = 13;
    string closing_timestamp = 14;
    double latitude = 15;
    double longitude = 16;
}
Transform
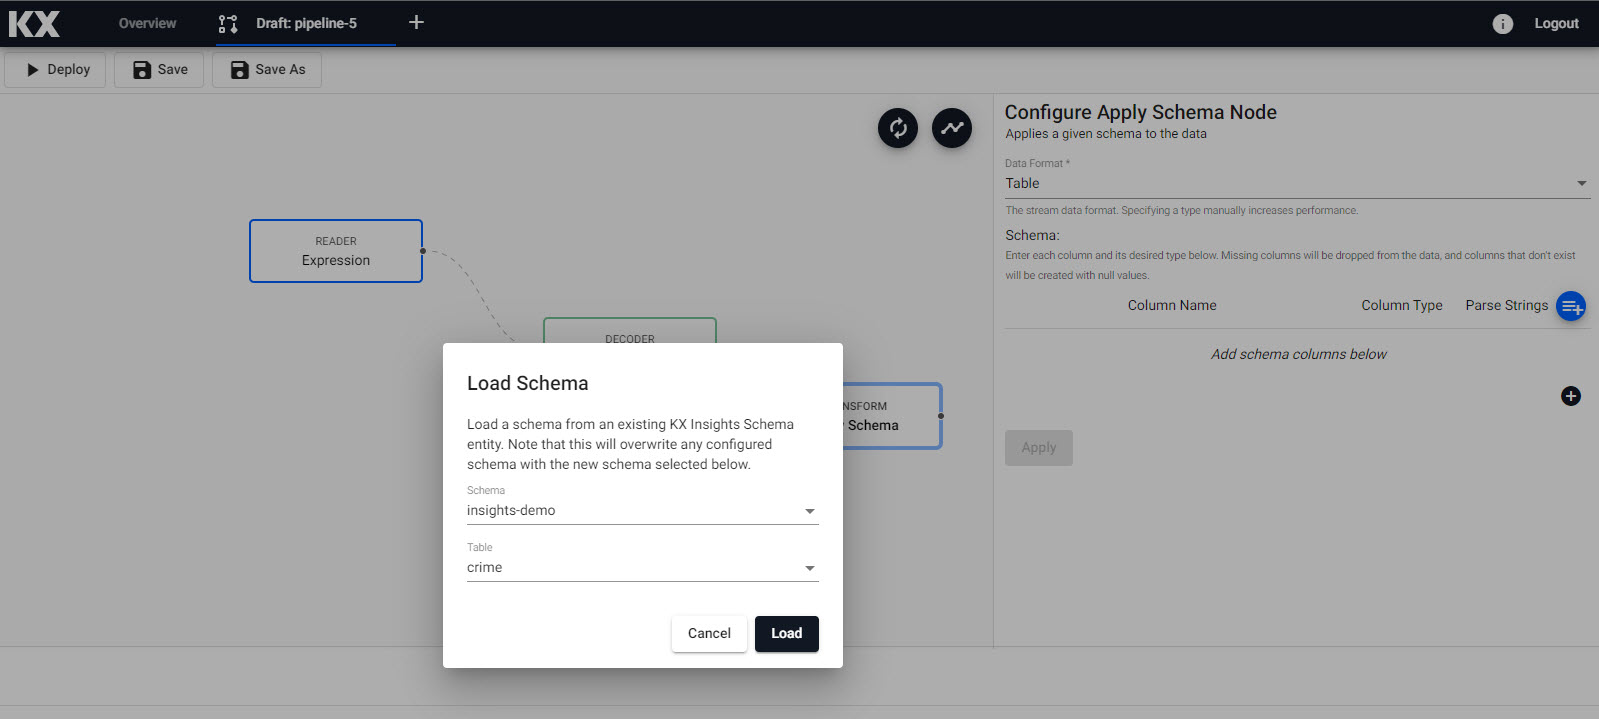
Next, click-and-drag the Apply a Schema node under Transform into the pipeline workspace. The schema transforms the data to a kdb+/q format compatible with the KX Insights Platform. The properties to edit are:
| setting | value |
|---|---|
| Data Format | Table |
| Schema | insights-demo |
| Table | crime |
With the loaded schema we next have to define what parsing we want to use for the data; this is typically done for time, timestamp and string variables and is defined as follows. This is an essential step, and may cause issues during pipeline deployment if incorrectly set:
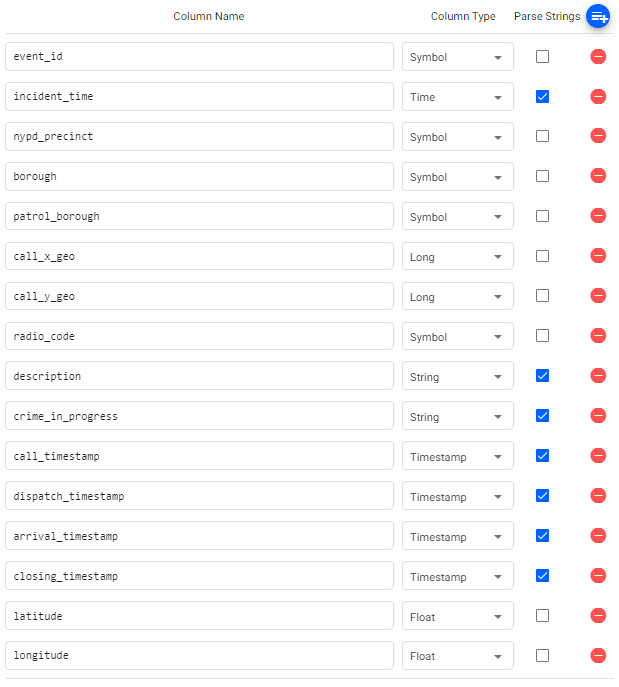
Parse Strings
This indicates whether parsing of input string data into other datatypes is required. Generally for all time, timestamp, string fields you should have Parse Strings ticked unless your input is IPC or RT.
Link the Apply a Schema transform node to the Protocols Buffer decoder
Writer
The last step of the data ingestion is to define where data will be written too. Click-and-drag into the pipeline workspace KX Insights Database from the list of Writers and connect to our existing pipeline.
| setting | value |
|---|---|
| Database | insights-demo |
| Table | crime |
| Deduplicate Stream | Yes |
Writer - KX Insights Database
The Writer - KX Insights Database node is essential for exploring data in a pipeline. This node defines which assembly and table to write the data too. As part of this, the assembly must also be deployed; deployments of an assembly or pipeline can de done individually, or a pipeline can be associated with an assembly and all pipelines associated with that assembly will be deployed when the latter is deployed.
Deploying
The next step is to deploy your pipeline that has been created in the above Importing stage; for Free Trial, there is a pipeline already named crime, so give this new pipeline a name like crime-1.
-
Save your pipeline giving it a name that is indicative of what you are trying to do.
-
Select Deploy.
-
Once deployed you can check on the progress of your pipeline back in the Overview pane where you started.
-
When it reaches
Status=Runningthen it is done and your data is loaded.
I want to learn more about Pipelines
Exploring
Select Explore from the Overview panel to start the process of exploring your loaded data. See here for an overview of the Explore Window.
In the Explore tab there are a few different options available to you, Query, SQL and q. Let's look at SQL.
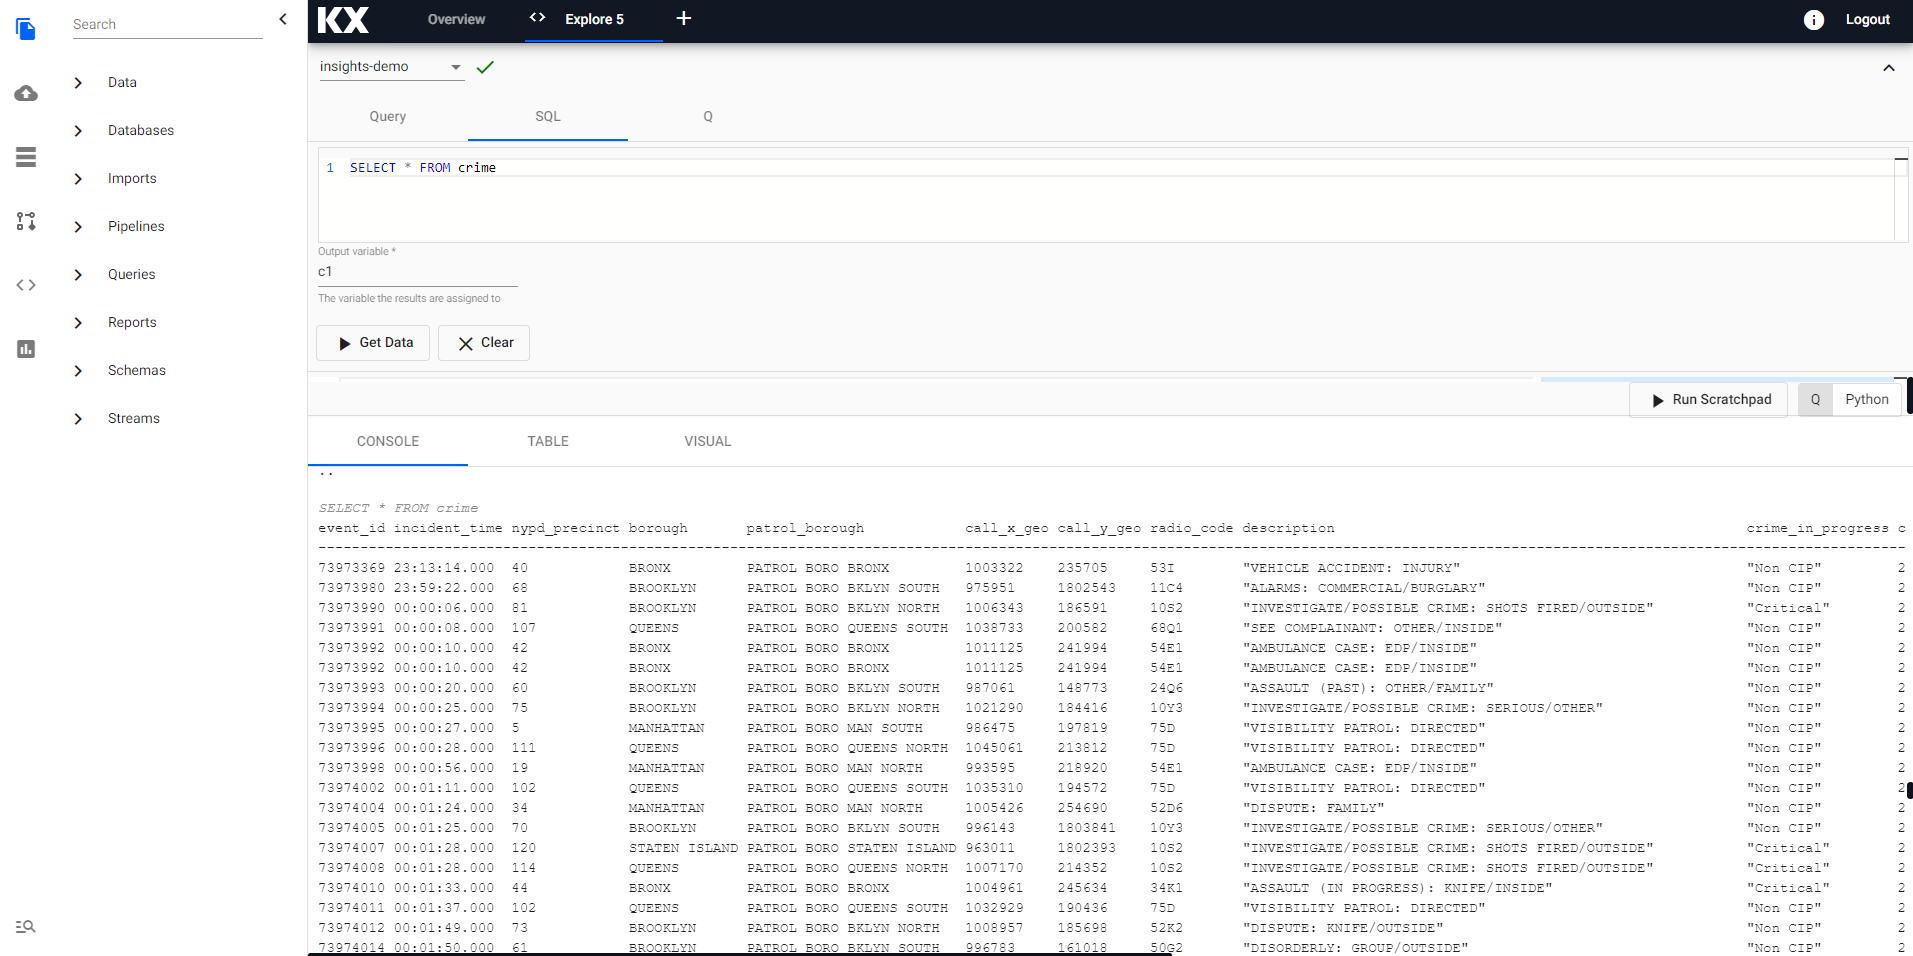
You can run the following SQL to retrieve from the crime table.
SELECT * FROM crimeNote that you will need to define an Output Variable and then select Get Data to execute the query. You should see the output below.
Refresh Browser
If the tables are not appearing in the Explore tab as expected - it is a good idea to refresh your browser and retry.
Troubleshooting
If the tables are still not outputting after refreshing your browser, try our Troubleshooting page.
Next let's visualize some data on a Report to better understand it. Head over the Reports to get started.