Explore
Explore lets you query your data using kdb+/q or sql. The dropdown shows the available assemblies. Once an assembly has been selected, a query can be saved to a variable using the "Get Data" form. Freeform queries can be run against these and output will be shown in the console, table or chart below.
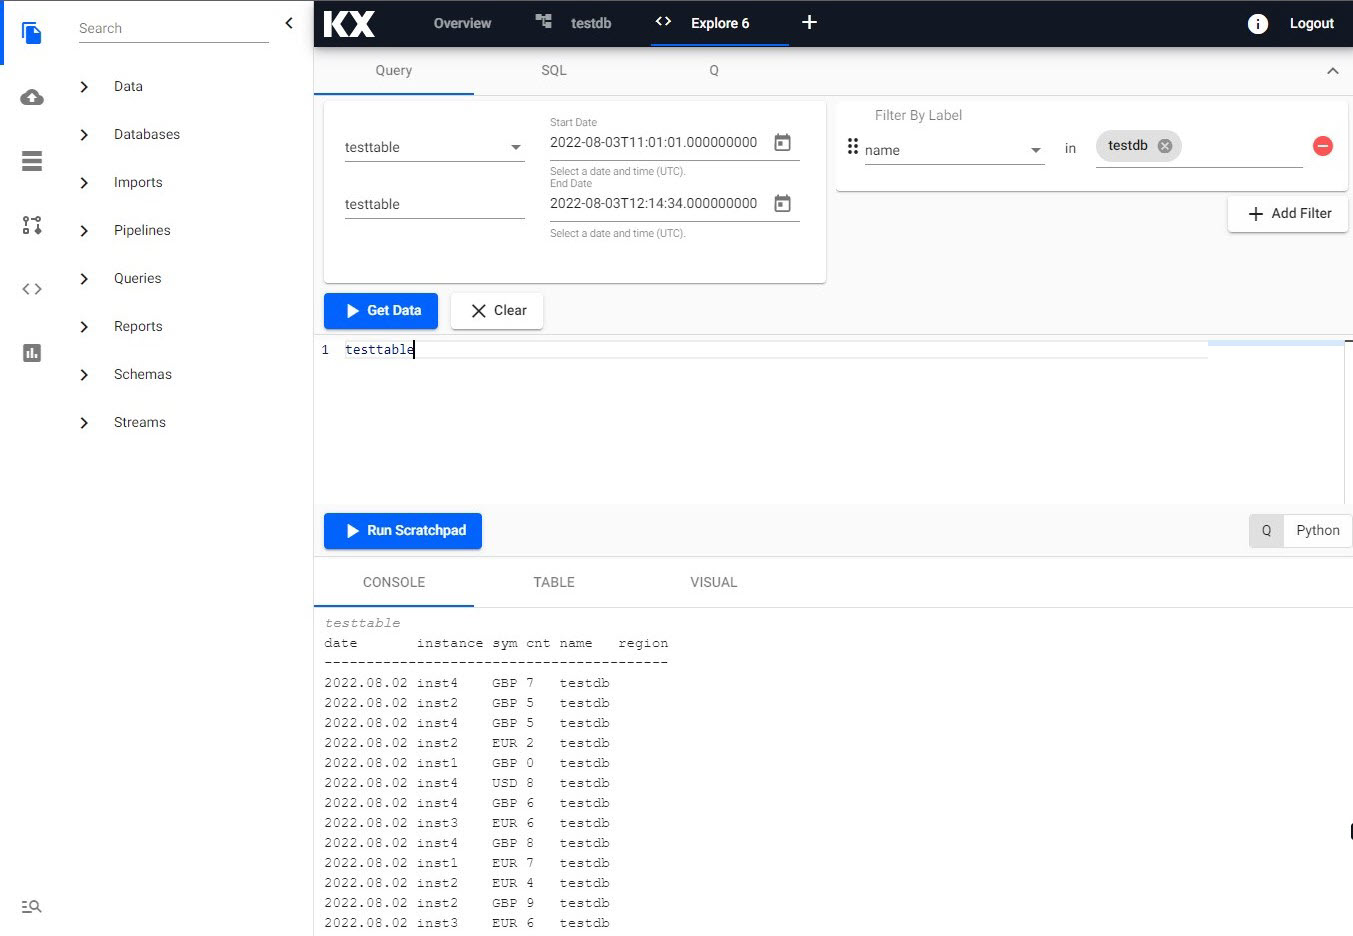
The central divider is a drag bar which can be resized to better view the query or outputted results.
Set up
-
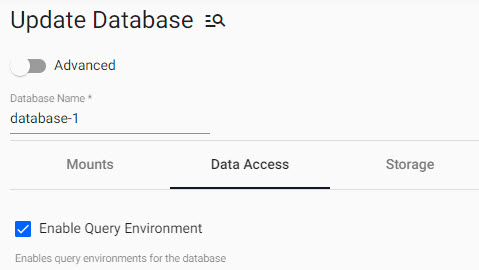
An active assembly with data is required for investigations; a deployed assembly will have a green tick when active (viewable in the left-hand entity tree menu). Prior to deployment of an assembly, ensure the Enable Query Enviroment under the Data Access tab of the associated database is checked.
-
Choose how to explore the data.
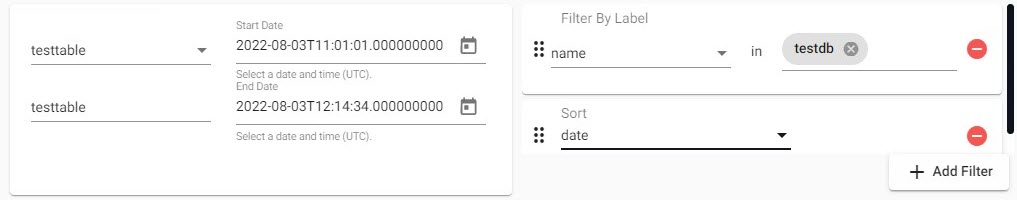
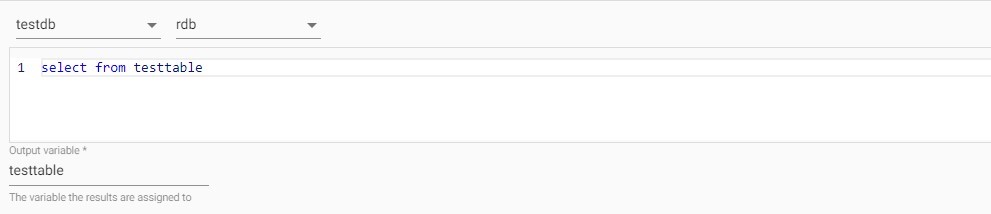
Query uses an input form to define the data to query. Select the dataset from the assembly and assign it to a variable; this variable will be referenced in the Scratchpad editor. When exploring with a query, a date range must be defined. Additional filters are also available, referenced in the GetData API.
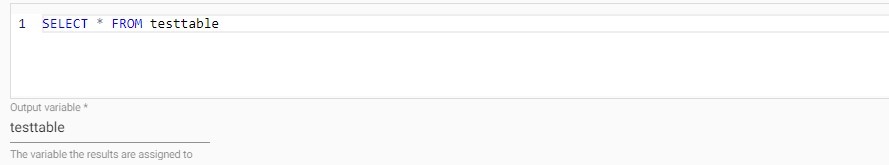
The data table can be referenced using SQL, and assigned to a variable for use in the scratchpad.
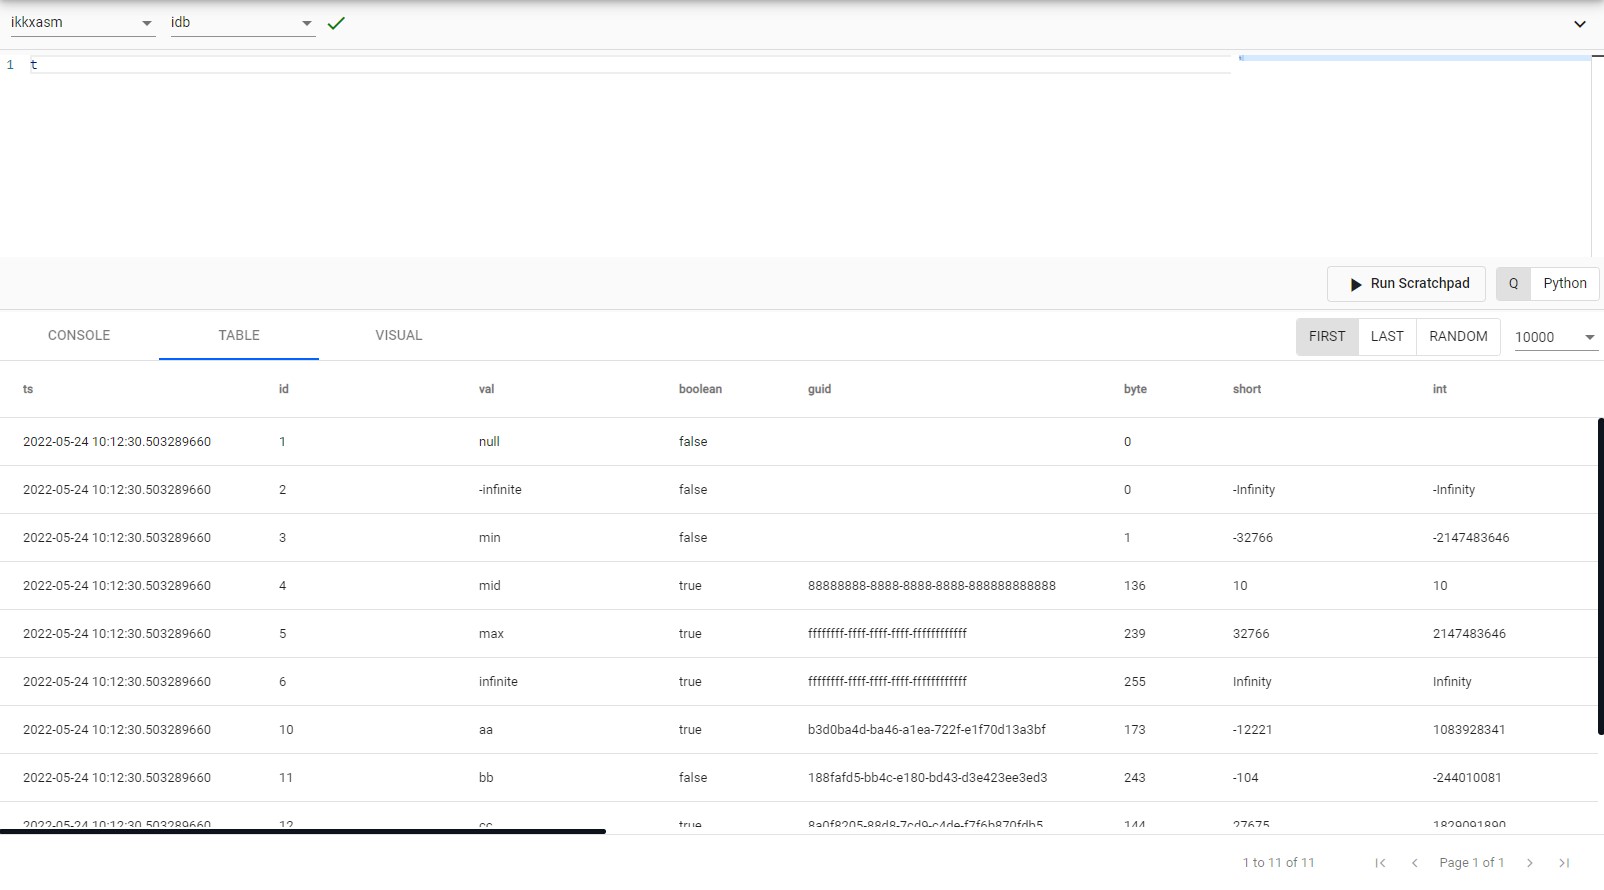
The data table can be referenced using q, and assigned to a variable for use in the scratchpad. The assembly and instance (rdb, hdb or idb) must be selected prior to getting data.
-
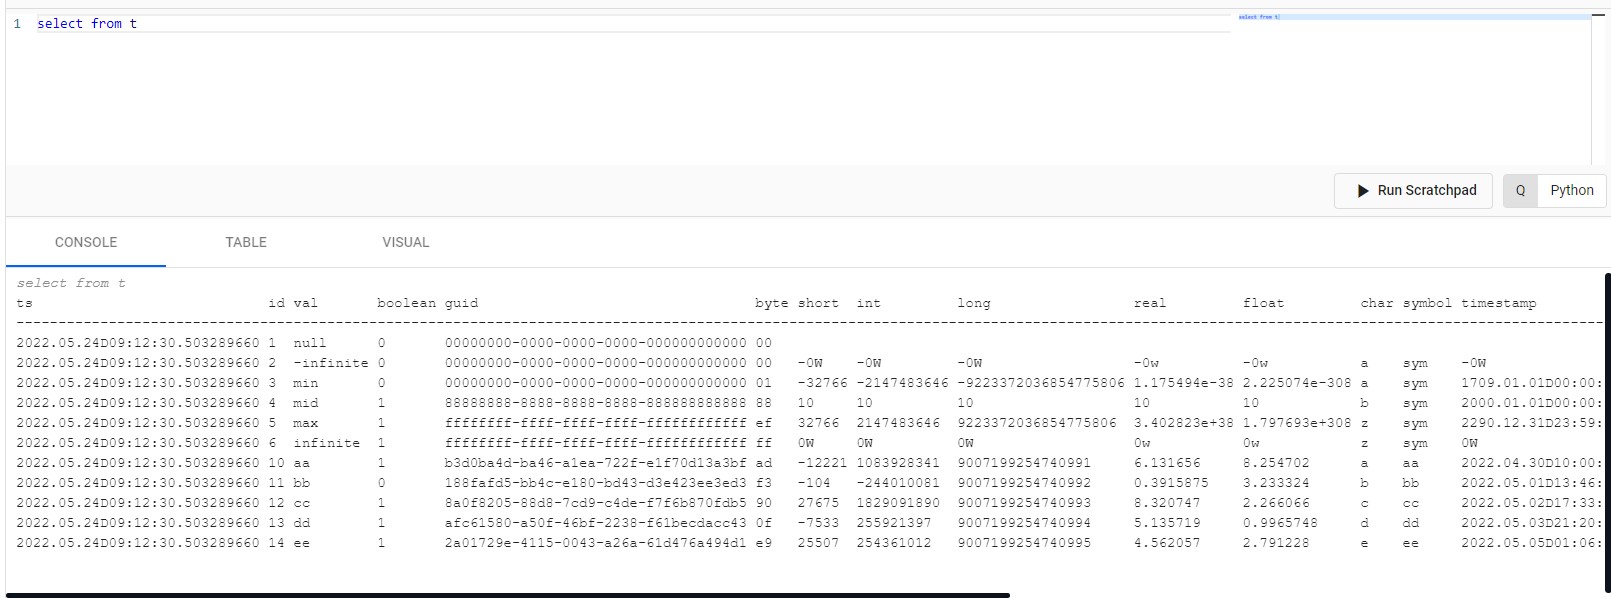
In the Scratchpad editor, query the created variable with kdb+/q or python.
-
The entire contents of the scratchpad can be evaluated with
Run Scratchpad. The current line or selection can be run with the keyboard shortcut of CTRL + Enter, or ⌘Enter on Mac.
Scratchpad Limitations
There is a (combined user) memory limit of 500MB for scratchpad queries. When exceeded, the scratchpad process will shut down and restart. To optimize performance, limit the amount of data returned in your query; for example: select[10000] from myTable to return 10,000 rows of data.
After a scratchpad restart, earlier results are removed and are no longer available.
Filtering by Label
One of the available filters is a Filter by Label option. This will allow the option to query specific tables in each assembly. To do so, select the key value of the label that was assigned to the assembly. Then select the value(s) of the label(s) to query from the tables that correspond to the label.
If no label is selected then all corresponding tables will be queried.
Options
Run Scratchpad
Executes the query. Results will be outputted in the lower, Console, Table or Visual panel.
Running Queries
When a line or selection is run, the context will by set by any preceding lines similar to \d .myContext or system "d .myContext". If there are no such lines, the global context will be used. This can be run using the keyboard shortcut of CTRL + Enter, or ⌘Enter on Mac.
Console
A console that can display the results of kdb+/q or python code executed in the scratchpad.
The console contains a context menu that can be accessed by right clicking on the console area.
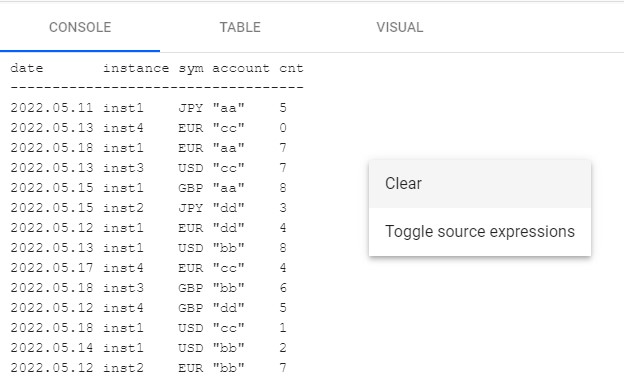
Clear
Clear the console
Toggle Source Expressions
Toggle whether the code expression generating the result will show in the console.
Code
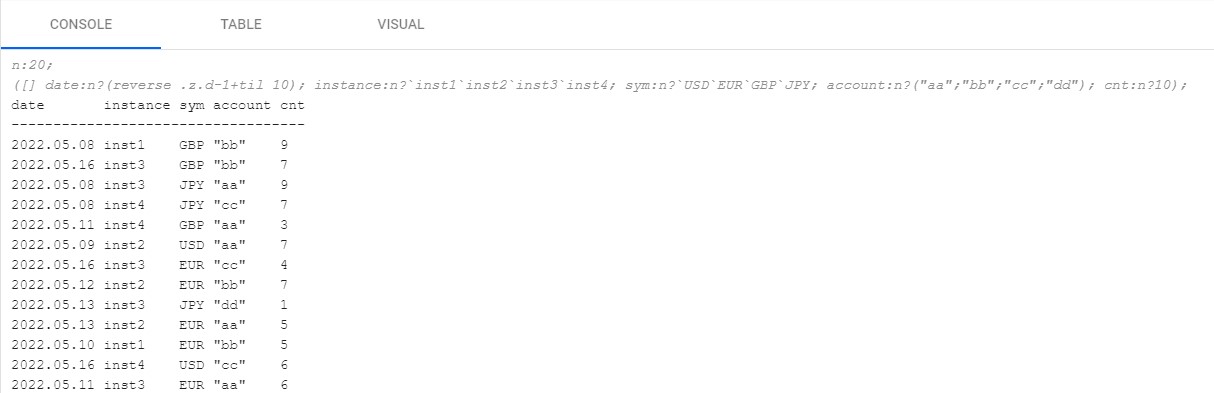
For example, taking this kdb+/q query:
n:20;
([] date:n?(reverse .z.d-1+til 10); instance:n?`inst1`inst2`inst3`inst4; sym:n?`USD`EUR`GBP`JPY; account:n?("aa";"bb";"cc";"dd"); cnt:n?10);
The following results will be displayed:
Query
Data can also be queried from a variable set in the Get Data section:
Table
Tabulated results from the query; results are paged.
- First
- Display results from the start of the data source (page 1).
- Last
- Display results from the end of the data source (last page).
- Random
- Select a random point in the data set to display results.
- 10
- 100
- 1000
- 10000
- Filter paged results by
10,100,1,000, or10,000results per page.
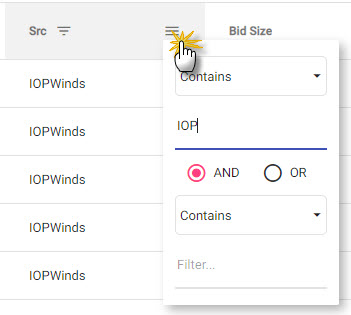
Column Filter
Data columns can be sorted in ascending and descending order on a header click.
Support for data filtering with AND/OR statements available as a dropdown menu option in the header; select between contains, not contains, equals, not equal, starts with, or ends with.
Visual
A chart of the result data; double click on an item to edit.
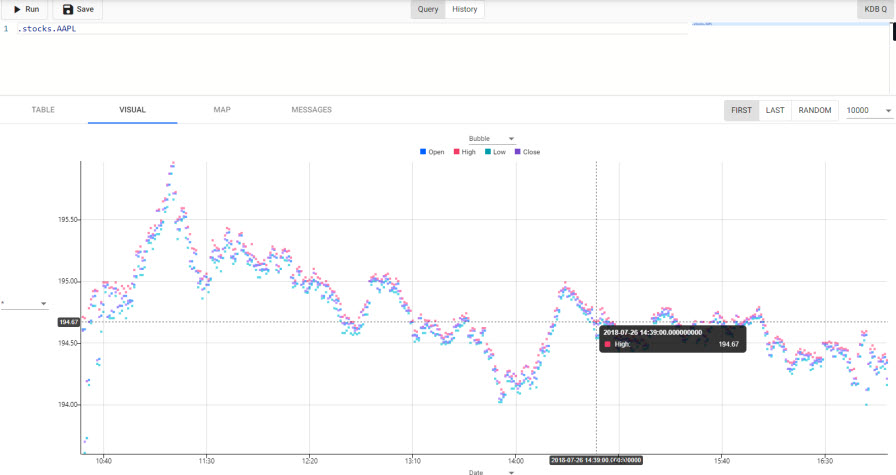
Chart Type
Select from Bubble, Line or Bar.
Define the data source variables to chart from the x- and y-axis drop-downs. Defaults to wildcard, *, for y-axis.
Display
Click the area above the chart to open menu.
Bubble
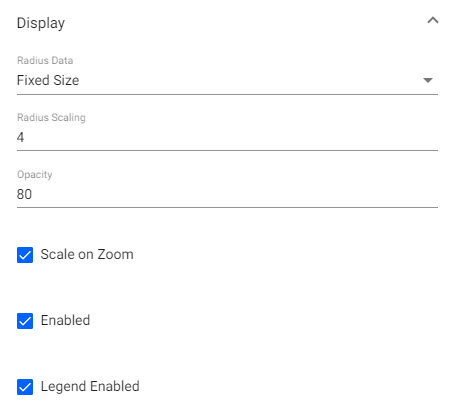
- Radius Data
- Choose between a data source variable or
Fixedsized bubbles. - Radius Scaling
- Sets the scaling of bubble size.
- Opacity
- Define the opacity of the bubble. Range 0 (transparent) to 100 (opaque).
- Scale on Zoom
- When enabled, bubbles will scale on zoom; increase in size on zoom in, decrease in size on zoom out.
- Enabled
- Plotted bubble data will display on chart when enabled.
- Legend Enabled
- Legend of plotted data will appear above chart when enabled.
Line
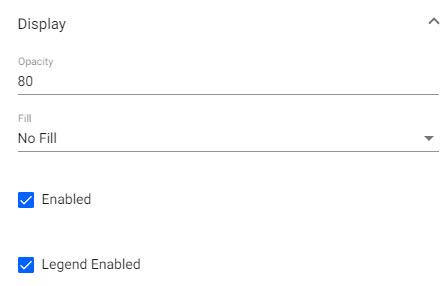
- Opacity
- Define the opacity of the line. Range 0 (transparent) to 100 (opaque).
- Fill
- Fill Color
- Fill Opacity
- Fade to Transparent
- Enable to fill the area of the line to the x-axis. Define Hex color, opacity of the fill area and optional transparency fade.
- Enabled
- Plotted line data will display on chart when enabled.
- Legend Enabled
- Legend of plotted data will appear above chart when enabled.
Bar
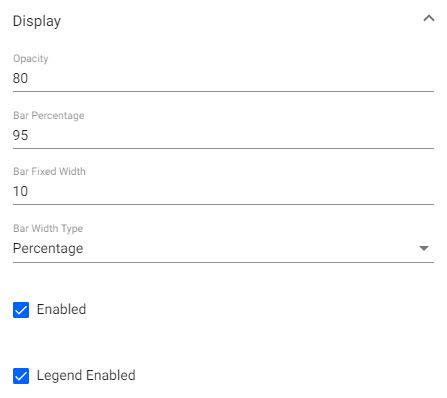
- Opacity
- Define the opacity of the bar. Range 0 (transparent) to 100 (opaque).
- Bar Percentage
- Set auto-size percentage width of bars
- Bar Fixed Width
- Set bar width in pixels.
- Bar Width Type
- Toggle between
PercentageorFixed Widthfor bar width. - Enabled
- Plotted bar data will display on chart when enabled.
- Legend Enabled
- Legend of plotted data will appear above chart when enabled.
Color Palette
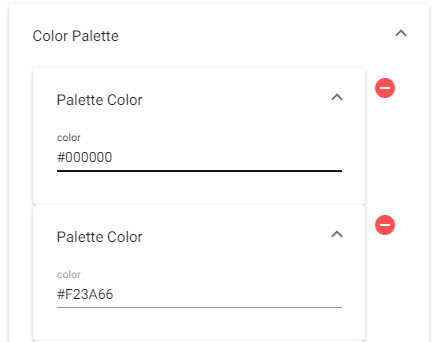
Define Hex color for each layer; plotted in order.
Animation
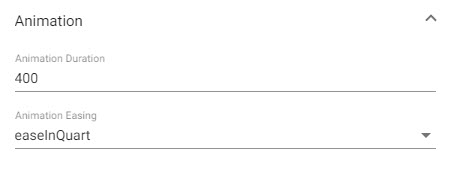
- Animation Duration
- Animation Easing
- Define zoom animation events and length of time in milliseconds to complete. Select from
swingFromTo,swingFrom,swingTo,easeFromTo,easeFrom,easeTo,easeInQuad,easeOutQuad,easeInOutQuad,easeInCubic,easeOutCubic,easeInOutCubic,easeInQuart,easeOutQuart,easeInOutQuart,easeInQuint,easeOutQuint,easeInSine,easeOutSine,easeInOutSine,easeInExpo,easeOutExpo,easeInOutExpo,easeInCirc,easeOutCirc,easeInOutCirc,easeOutBounce,easeInBack,easeOutBack,easeInOutBack,bounce,bouncePast,elastic.
Overlay
- Show Crosshairs
- Adds a crosshair to the chart.
- Show Coordinates
- Displays axis values for cursor position in chart.
- Snap Crosshair to Data
- Crosshair position locks to y-axis value relative to x-axis postion.
- Show all data points
- Crosshair displays all values in tooltip at x-axis position.
- Group tooltip by layer
- Group display of chart values in the tooltip by data layers.
X- and Y-Axis
Define from x- and y-axis dropdowns, the data source variables to chart. This can be selected by clicking the region in which the X- and Y-Axis are displayed.
- Number of Ticks
- Define number of tick labels to display in the y-axis.
Range
- Use min max
- Min
- Max
- Use minimum and maximum values of data range to define y-axis range.
Gridlines
- Offset Gridlines
- When enabled, sets gridlines between tick values.
- Gridlines Opacity
- Defines the opacity of gridlines from
0(transparent) to100(opaque).
Format
- Display
- When enabled, displays tick values.
- Begin at Zero
- When enabled, plotted values will start at 0 for the y-axis.
- Numeric Format
- Select between
Number,Smart NumberandFormatted Number. - Decimal Places
- Define precision of y-axis labels.
- Font size
- Define font-size of tick labels.
- Prefix
- Suffix
- Add a text component before or after y-axis tick label.
- Hide Trailing Zeroes
- When enabled, hides trailing zeroes from axis label.
- 10
- 100
- 1000
- 10000
- Filter paged results by
10,100,1,000, or10,000results per page.