Analytics and Real-Time Engine
This page covers inspecting the Real-Time Database (RDB) to verify your setup, writing a custom q analytic in KX Analyst, and creating the real-time engine (RTE) that will publish simulated telemetry data into the system.
Inspect the RDB with KX Analyst
At this step, you'll examine running processes using KX Analyst. You'll connect to the RDB and verify that data is being captured correctly and will be written to the HDB by the end-of-day job.
KX Analyst is a visual environment for exploring and managing datasets in real-time using kdb+ server-based analytics.
Refer to the KX Analyst site for full documentation.
Connect to the running RDB
Follow these steps to open the IDE on the airTelRDB.1 task:
- In Process Library Status, find the task associated with the
airTelRDBinstance. - Right-click the task and select Connect (or open the IDE from the task context menu).
-
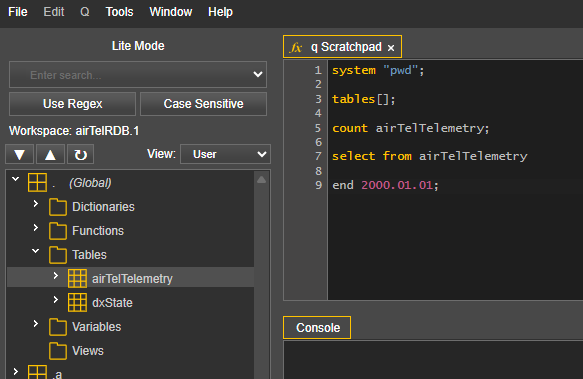
Expand the global tables folder to see available tables.
Run verification commands
Run each of the following commands in sequence using Ctrl+D when on the same line as the command or right-click > Display:
| Command | Expected output |
|---|---|
system "pwd"; |
/home/yourhomedir/kxinstall/delta-data/airTelData/hdbData |
tables[]; |
`s#`airTelTelemetry`dxState |
count airTelTelemetry; |
0 (no data yet — this is correct) |
select from airTelTelemetry; |
An empty table with the correct column headers:timestamp aircraftId altitude speed temperature pressure-------------------------------------------------------- |
Unexpected results
If any results are unexpected, review the configuration steps for all components before continuing.
Create analytics
To feed simulated telemetry into the system, you will create a custom q analytic function in KX Analyst, then export it to KX Control so the RTE process can use it.
Open a workspace
- From the KX Delta Platform home page, click KX Analyst.
- Leave all popup parameters as-is and click Connect.
- Name the workspace
airTelWorkspace.
Set up a Git repository (Optional)
KX Analyst supports Git integration for version control and collaboration. You can either create a local repository without Git integration or clone an existing Git repository into KX Analyst.
Create a repository without Git
Use this option if you do not need source control integration.
- In the workspace panel, right-click and select Repository.
- Enter a repository name.
- Leave the Origin field blank to automatically generate it from the repository name.
- Click OK to create the repository.
The repository is now available in the workspace, where you can add modules and functions and export them to KX Control.
Clone a repository with Git
Use this option if your project is managed in Git.
- Create (or obtain access to) a Git repository and copy its SSH path.
- Copy the repository clone URL using the repository’s Code button.
- Right click in the KX Analyst workspace panel and choose Git > Clone.
-
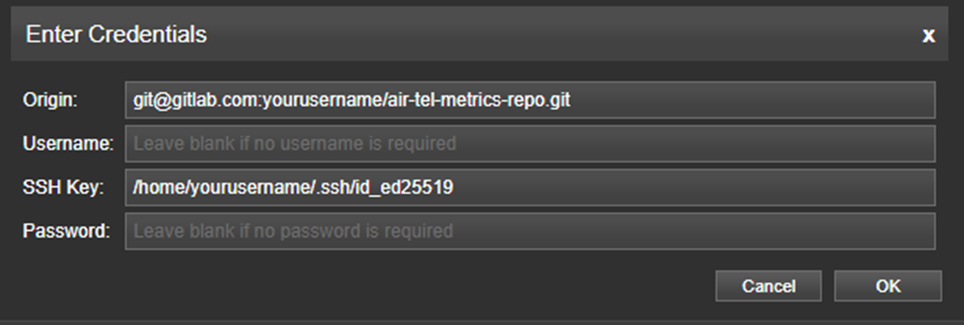
Enter your repository URL in the Origin field and the SSH key copied previously, then click OK.
-
Click OK again when the Pull Repository dialog shows to clone the repository locally.
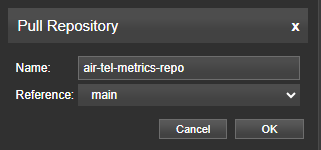
The cloned repository will appear in the workspace tree and is ready for development and version-controlled changes.
Test the dummy data function in a q Scratchpad
In the default q Scratchpad, enter and run the following code:
dummyTelemetry:([]
    timestamp:    .z.p;
    aircraftId:   1?`AC001`AC002`AC003`AC004`AC005`AC006`AC007`AC008`AC009`AC010;
    altitude:     first 42000 +1?100;
    speed:        first 600 +1?50;
    temperature:  first -10 +1?20;
    pressure:     first 800 +1?200
    )
Highlight the code and press Ctrl+D to display the result. You should see a single row similar to:
timestamp                     aircraftId altitude speed temperature pressure
----------------------------------------------------------------------------
2026.04.12D10:25:16.620806511 AC005      42002    609   1           886
Run it several times and observe the values changing slightly each time.
Note
If you see errors, try placing all the code on a single line and adjust the tabbing until it runs.
Create a module
- Right-click the
air-tel-metrics-repomodule in the tree on the left and select New > Module. - Name it
airTelDummyDataand click OK.
Create the load function
-
Right-click the
airTelDummyDatamodule and select New > Function. -
Using dot notation, name the function
.airTelDummyData.loadDummyData. This syntax correctly associates the function with its parent module. -
You will be given an empty function definition template. Enter the following code into the editor:
// @fileOverview Function to publish simulated aircraft telemetry data that varies slightly each call, within limits. // @returns {Type} Does not return anything. {[] dummyTelemetry:([] timestamp: .z.p; aircraftId: 1?`AC001`AC002`AC003`AC004`AC005`AC006`AC007`AC008`AC009`AC010; altitude: first 42000 +1?100; speed: first 600 +1?50; temperature: first -10 +1?20; pressure: first 800 +1?200 ) } -
Click Save, then open a q scratchpad and execute the function by running the following code. Use Ctrl+D or right-click > Display to view the result.
.airTelDummyData.loadDummyData[]You should see a single row similar to:
timestamp aircraftId altitude speed temperature pressure ---------------------------------------------------------------------------- 2026.04.12D11:00:33.530935922 AC005 42083 638 -4 993 -
Now make a single change to the function so that the dummy data is published to a table and all its subscribers. Add a semicolon to close the table definition, then add the
.d.pubcall on the final line:// @fileOverview Function to publish simulated aircraft telemetry data that varies slightly each call, within limits. // @returns {Type} Does not return anything. {[] dummyTelemetry:([] timestamp: .z.p; aircraftId: 1?`AC001`AC002`AC003`AC004`AC005`AC006`AC007`AC008`AC009`AC010; altitude: first 42000 +1?100; speed: first 600 +1?50; temperature: first -10 +1?20; pressure: first 800 +1?200 ); .d.pub[`airTelTelemetry;dummyTelemetry]; }Note
Note the semicolon at the end of the table definition closing bracket
)— this is required before calling.d.pub. The.d.pubcall publishes the generated row toairTelTelemetryand notifies all subscribers. -
Click Save.
Export the analytic to KX Control
Warning
Pushing a module to KX Analyst does not automatically make it available in KX Control. You must explicitly export it.
- Right-click the
airTelDummyDataanalytic and select Control > Export as Analytic Group(s). - Click OK.
- Confirm the success message appears in the bottom-left of your screen.
Create a real-time engine (RTE)
To feed dummy data into the system that matches the schema created earlier, you must configure both the analytic defined in the previous section and a Real-Time Engine (RTE) process. In this section, you will create the RTE process, associate the analytic with it using the initialStateFunct function, and add the process to the workflow. Before updating the workflow configuration, you will verify that the function used by the RTE process correctly publishes data to its associated RDB process.
The real-time engine (RTE) will run the loadDummyData function to generate and publish simulated telemetry records to the metrics plant.
Create the RTE process
- Switch to the KX Control browser tab.
- Right-click the Process Library and select New > Process Instance.
- Name the instance
airTelRTE, select theairTelPackageas the package, set the template toDS_RTE, and click Add. - In Instance Details, add a description.
- In Reserved Params, set:
- Host:
localhost - Port:
8004
- Host:
-
In Instance Params, set:
- messagingServer:
DS_MESSAGING_SERVER:airTelMessagingServer - publishChannel:
datafeed - publishTableList:
airTelTelemetry
Why is
publishTableListimportant?When the RTE publishes data, the messaging server notifies all processes that have subscribed to the
datafeedchannel. This keeps the RDB (and any other subscribers) current. - messagingServer:
-
In the Schemas subtab, associate
airTelSchemaGroup. - In the Analytics subtab, associate the
airTelDummyDatagroup. - Click Save.
Start the workflow and RTE
- Start
airTelWorkflowand confirm all components are green in the Graph view. - Start
airTelRTEseparately. -
Review the partial log for
airTelRTEand confirm a line similar to the following appears:Messaging - adding subscription ### (`airTelMetricsPlant.1;`sourceId`consumerId`topic`channel!(22806531i;22806529i;,\"airTelTelemetry\";,`datafeed))
Execute the function and verify data
- Connect to the RTE process by right-clicking the
airTelRTEtask in the Process Library and selecting Connect. -
In the connected session, open the (Global) module and table folder, then open the q scratchpad.
Note
This is the typical setup when working with an instance. The left panel displays the code modules available within the process. Note that the
airTelTelemetrytable is present.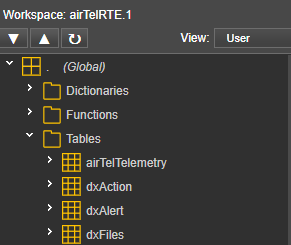
-
In the q scratchpad, run
tables[];and confirmairTelTelemetryis listed. -
Next, execute the function that generates simulated aircraft telemetry data. Execute the following command three times:
.airTelDummyData.loadDummyData[];Note
Each execution publishes a new telemetry record. When data is added to the published tables, the messaging server notifies subscribed processes so they can update automatically.
-
Open a connection to the
airTelRDBprocess and run the following command to inspect the contents of theairTelTelemetrytable:select from airTelTelemetry;You should see three rows:
timestamp                     aircraftId altitude speed temperature pressure
----------------------------------------------------------------------------
2026.04.15D10:51:37.394012852 AC008      42070    615   1           819
2026.04.15D10:51:40.852280353 AC005      42025    625   -3          895
2026.04.15D10:51:50.505985028 AC010      42045    606   -4          838
Experiment by running the function more times and watching the RDB grow.
Troubleshooting — if no data appears:
- Have you associated the schemas with both the RTE and RDB?
- Have you associated the analytic module with the RTE?
- Is the RDB subscribed to
datafeed? - Is the RTE publishing to
datafeedwithairTelTelemetrydeclared? - Is the messaging server connected via the config parameter in both RTE and RDB?
- Does the config parameter table have any blank lines?
Next step
Proceed to Automation and dashboard to automate the data feed on a timer and build a live dashboard to visualize the telemetry.