Automation and Dashboard
This page covers automating the simulated telemetry feed on a 1-second timer, then building a live KX Dashboard to visualize the data.
Automating the telemetry feed
Currently, you must manually call .airTelDummyData.loadDummyData[] each time you want data. In this section, you will configure the RTE to call it automatically on a 1-second timer.
Create the initialization function
- Open KX Analyst and connect to
airTelWorkspacewhen prompted. - Add a new function under the
airTelDummyDatamodule and name it.airTelDummyData.initRTE. -
Enter the following code:
// @fileOverview Initialises the real time engine on a timer. When this code executes, it will start a timer that will execute the loadDummyData with a parameter of 1 every 1000ms.
// @returns {Type} Returns nothing.
{[]
    .d.prcl.addFunctToTimer[`.airTelDummyData.loadDummyData; (); 0Nz; 0Nz; 1000; 1b];
    }
When this code executes, it starts a timer that executes the
loadDummyDataevery 1000ms. Refer to the timer API to understand how this inbuilt timer function works. -
Click Save.
- Export the analytic to KX Control: right-click
airTelDummyDataand select Export to Control > Export as Analytic Group(s), then click OK.
Test the timer manually
- Restart the workflow and the RTE.
- Open the RTE and RDB in the IDE.
-
Connect to the RTE instance in the IDE and run:
.airTelDummyData.initRTE[] -
Switch to the RDB instance and run:
count airTelTelemetry;Press Ctrl+D repeatedly — the row count should increase by one each second.
If the count is not increasing, check that you have added the initRTE function correctly and executed it in the RTE.
Configure auto-start
To make the timer start automatically whenever the RTE initializes:
- Stop the workflow and the RTE in KX Control.
- Refresh the tree to pick up the exported analytic changes.
-
In the Instance Params subtab of
airTelRTE, setinitialStateFuncto.airTelDummyData.initRTE.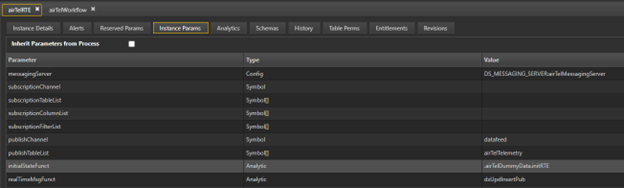
-
Confirm that
airTelDummyDatais still listed in the Selected Analytics section of the Analytics tab. - Restart the workflow.
Confirm data is building
Connect to the RDB process and run count airTelTelemetry; repeatedly. The count should increase by approximately one per second, confirming the automated feed is running.
The addition of .airTelDummyData.initRTE to the initialStateFunc parameter means the timer now starts automatically every time airTelRTE starts within the workflow.
Create a dashboard
With live data flowing into the RDB, you can now visualize it using KX Dashboard Builder — a browser-based tool included with KX Delta Platform.
Open Dashboard Builder
- In KX Control, navigate to Tools > Open Builder > Dashboard Builder from the top menu.
- The builder opens in a new browser tab at the demo screen.
-
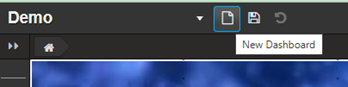
Click the New Document icon.
-
Name the dashboard
airTelDashboard. The dashboard opens in the Builder view, with the new dashboard name displayed in the upper-left corner.
Create a connection to the RDB
- Click Connections at the bottom of the configuration options panel on the right.
-
Click New and enter the following:
Field Value Name airTelRDBConnectionHost localhostPort 8003Password * Confirm Password * TLS Unchecked -
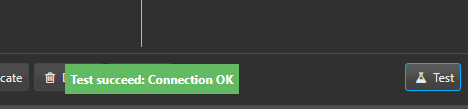
Click Test to verify the connection. If the test fails, confirm the RDB is running on port 8003.
-
Click Save and close the dialog.
Create a table grid
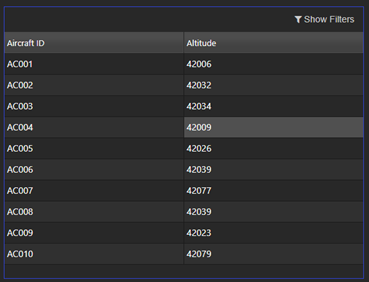
This grid will show the latest altitude for each aircraft, updating every second, with color-coded highlights for climbs and descents.
-
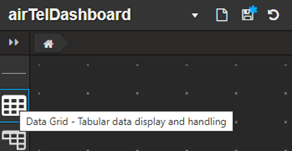
Drag the Data Grid component from the left panel onto the layout area.
-
Click to populate the data source.
- Click New and rename the node to
lastAltitude. -
Edit the datasource as follows:
- Select
airTelRDBConnectionat the top of the data source dialog. -
Enter the following query:
select last altitude by aircraftId from airTelTelemetry -
Set Subscription to Polling and Interval to 1 second.
- Set Max Rows to 1000.
- Click Execute to preview the data, then Apply to save the changes.
- Click Select Item to add the query to the current chart.
- Click Close.
- Select
Clean up the grid appearance
In Design mode with the grid selected, make the following changes in the right-hand panel.
Note
This menu is context sensitive so will not appear if you do not click into the grid in Design mode.
In the Basics tab, uncheck:
- Filter visible
- Enable grouping
In File export, uncheck:
- Show Export CSV Button
- Show Export Excel Button
Click Preview to confirm the grid is updating cleanly. Experiment with column widths, labels, text alignments, and border styles to suit your preference.
Add highlight rules for altitude changes
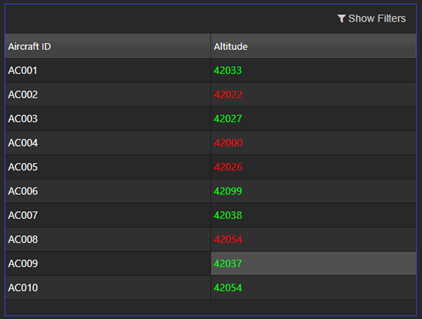
- In Design mode, click Highlight Rules in the grid's configuration panel.
-
Click + to add a new highlight rule, named
aircraft climb:- Target and Condition Source:
altitude - Condition Operator:
> - Color: Green
- Target and Condition Source:
-
Click + to add a new highlight rule, named
aircraft descend:- Target and Condition Source:
altitude - Condition Operator:
< - Color: Red
- Target and Condition Source:
You should now see the aircraft altitude climb and descend slightly during the flight.
Click Save (the floppy disk icon at the top of the screen).
Create a dropdown list
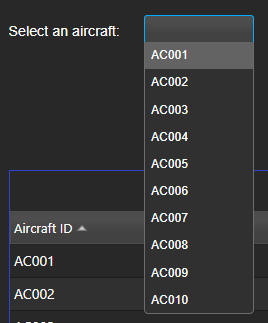
The dropdown will allow users to select an aircraft ID, which will drive the line graph in the next step.
-
Drag the Drop Down List icon onto the layout area.
-
In the Basics section, click the Data Source field and create a new data source.
-
Right click on the name and rename it to
uniqueAircraft. -
Select
airTelRDBConnectionat the top of the dialog box and enter:`aircraftId xasc select distinct aircraftId from airTelTelemetry -
Click Execute, then Apply.
-
Click Select Item to close the dialog.
-
-
Click Preview and confirm the dropdown lists aircraft IDs such as AC001, AC002, etc.
Note
If nothing is showing, confirm you have clicked both Apply and Select Item — missing either step is the most common cause.
Map the selected value to a view state:
-
Click the Selected Value field to open a dialog box.
-
Create a new view state named
name, with typesymboland default valueAC001. Note that the current value will also change toAC001. -
Click Select Item to close the dialog.
-
In Data Source Mapping, confirm
aircraftIdis set as both Value and Text.
Create a line graph
This graph will redraw whenever the user selects a different aircraft in the dropdown.
-
Drag the Line Graph icon onto the layout area, positioning it alongside the other components.
-
In the Basics section, click on the Datasource field and add a new datasource.
-
Right-click on the name and rename the datasource to
symbolAircraft. -
Select
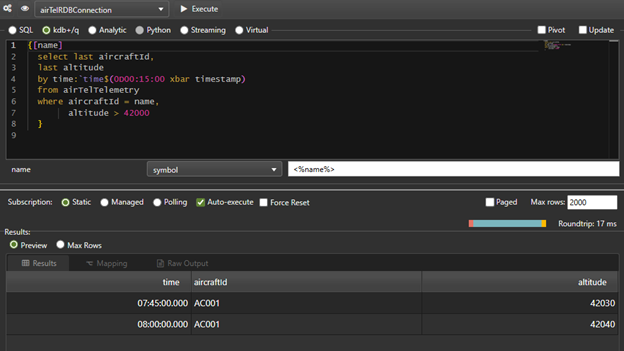
airTelRDBConnectionat the top of the dialog and enter the following query:{[name] select last aircraftId, last altitude by time:`time$(0D00:15:00 xbar timestamp) from airTelTelemetry where aircraftId = name, altitude > 42000 }Note
This query returns data grouped into 15-minute chunks using
xbar. The[name]argument is linked to the dropdown's selected value, so the graph redraws when a new aircraft is chosen. -
In the value field below the function declaration, enter
<%name%>to pass the dropdown selection into the query as thenameargument. -
Click Execute
-
Click Apply, then Select Item to close the dialog.
-
Configure the graph settings in the side panel:
- Set Focus to the
nameview state. - In Layers, set the graph type to Line.
-
In x-axis settings:
- X-Axis Type:
time - Tick Spacing: Fixed Tick Interval (ms)
- Value:
900000(15 minutes in milliseconds — matches thexbarinterval in the query)
- Value:
- X-Axis Type:
-
In y-axis settings:
- Check Use Min/Max
- Min:
41000 - Max:
43000
Leave the workflow running. Every 15 minutes you should see a small variation in altitude reflected in the line graph as new data bands accumulate.
Click Save.
Summary
You have now built a complete, end-to-end aircraft telemetry system on KX Delta Platform:
- A schema defines the structure of the telemetry data.
- A messaging server enables processes to discover and communicate with each other.
- A metrics plant logs and distributes all incoming records.
- An HDB stores historical data on disk; an RDB holds today's data in memory.
- A workflow orchestrates all components with proper startup dependencies.
- A real-time engine generates and publishes simulated telemetry on a 1-second timer using a custom q analytic.
- A dashboard visualizes live altitude data in a table grid and line graph, with interactive filtering by aircraft ID.
This pattern — define schemas, configure infrastructure, write analytics, automate, and visualize — is the foundation for any data capture system you build on KX Delta Platform.