Views Overview
This page provides an overview of kdb Insights Enterprise Views.
kdb Insights Enterprise Views is an embedded version of KX Dashboards which enables you to create visualizations of your data. Using the drag and drop interface you can build Views containing feature rich components such as charts, maps, data grids and many other components. These visualization help you to analyze and gain insights from your data.
kdb Insights Enterprise supports over 40 components, which can be added to your Views.
Demo views
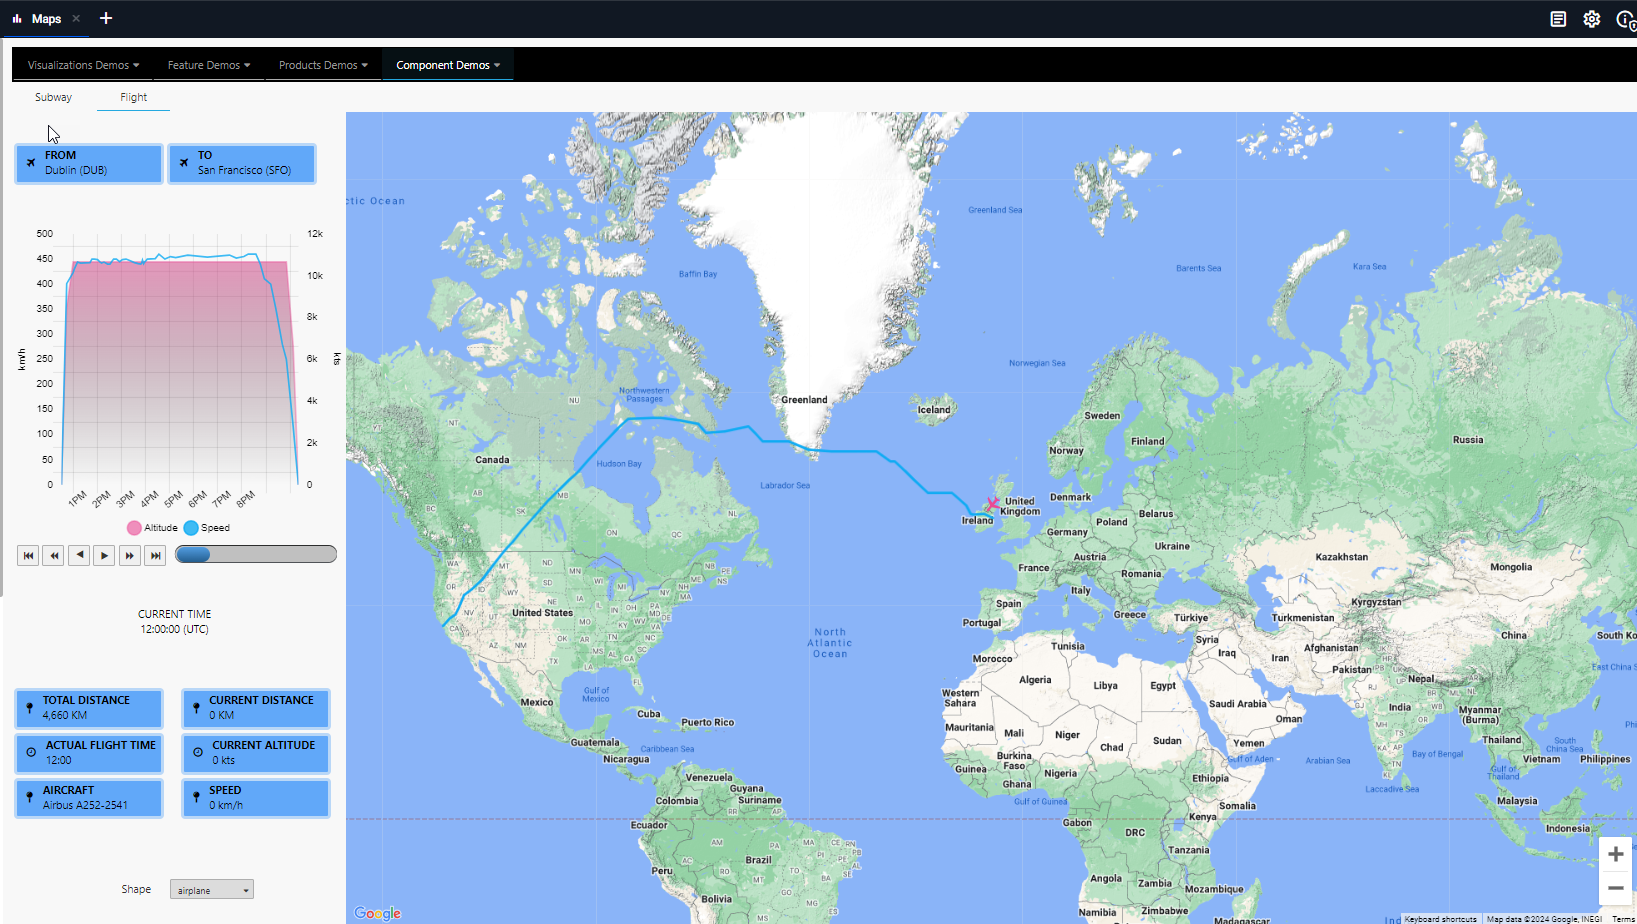
kdb Insights Enterprise comes populated with a set of demonstration Views which provide a catalog of fully interactive examples designed to illustrate the end-to-end capabilities of kdb Insights Enterprise visualization and analytic components.
To access these demo Views:
- Use one of the following methods:
- Click Views on the left-hand menu and then click Demos
- Click View Demos on the Views quick action on the Overview page
-
Click on a View name to open it. For example click Visualize to open the Visualize View.
This dashboard presents a rich set of interactive visualizations designed to support exploratory data analysis and insight generation across diverse datasets.
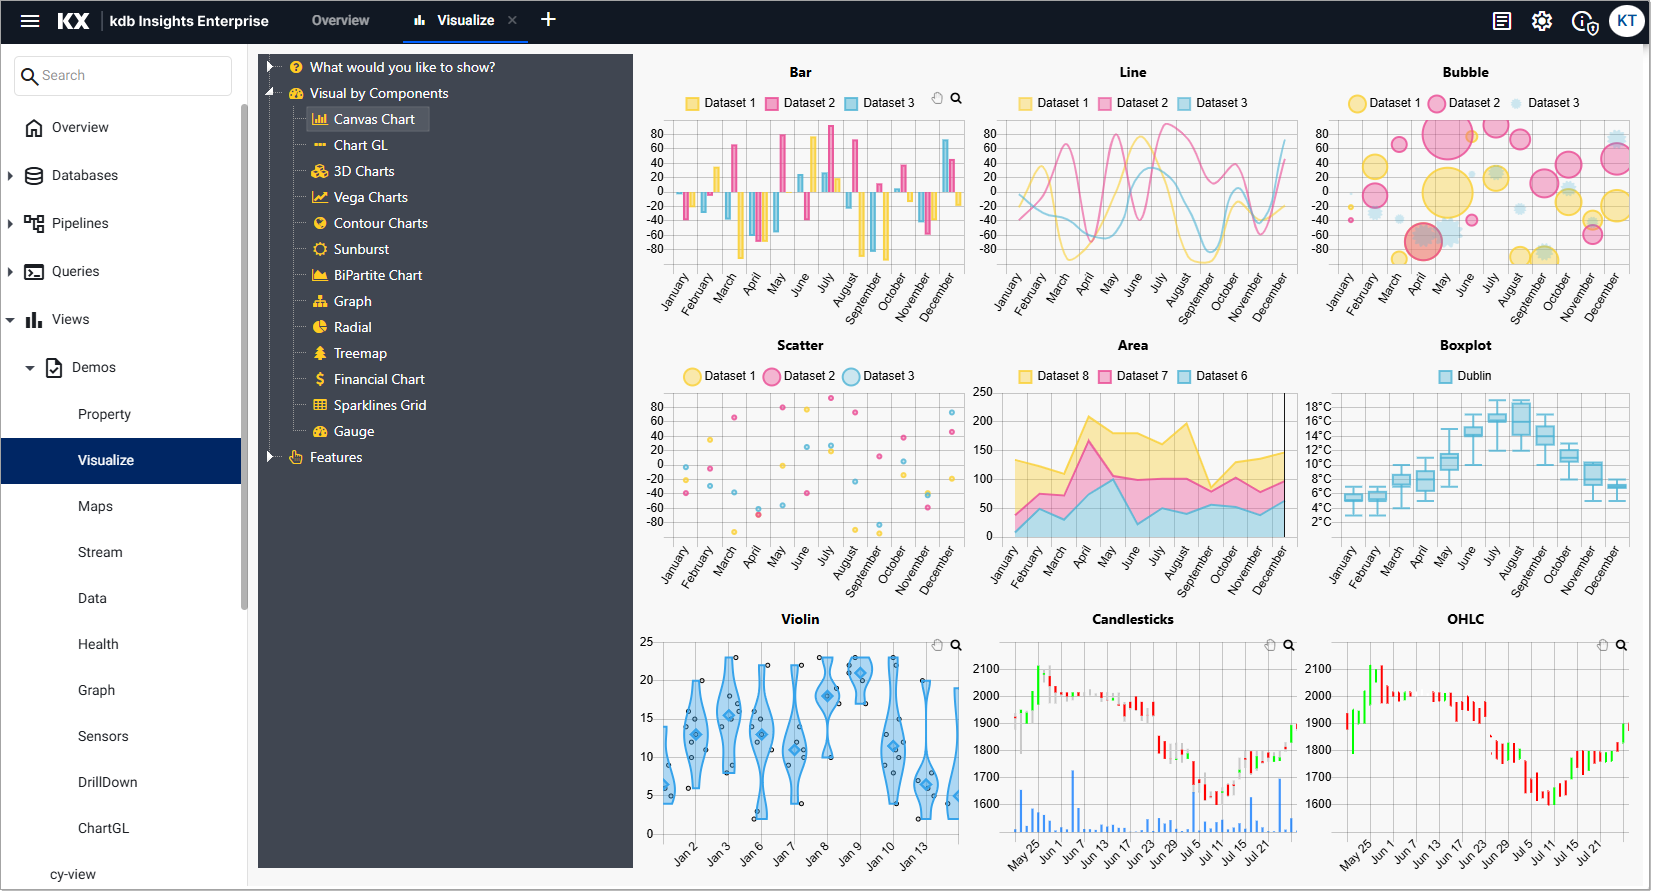
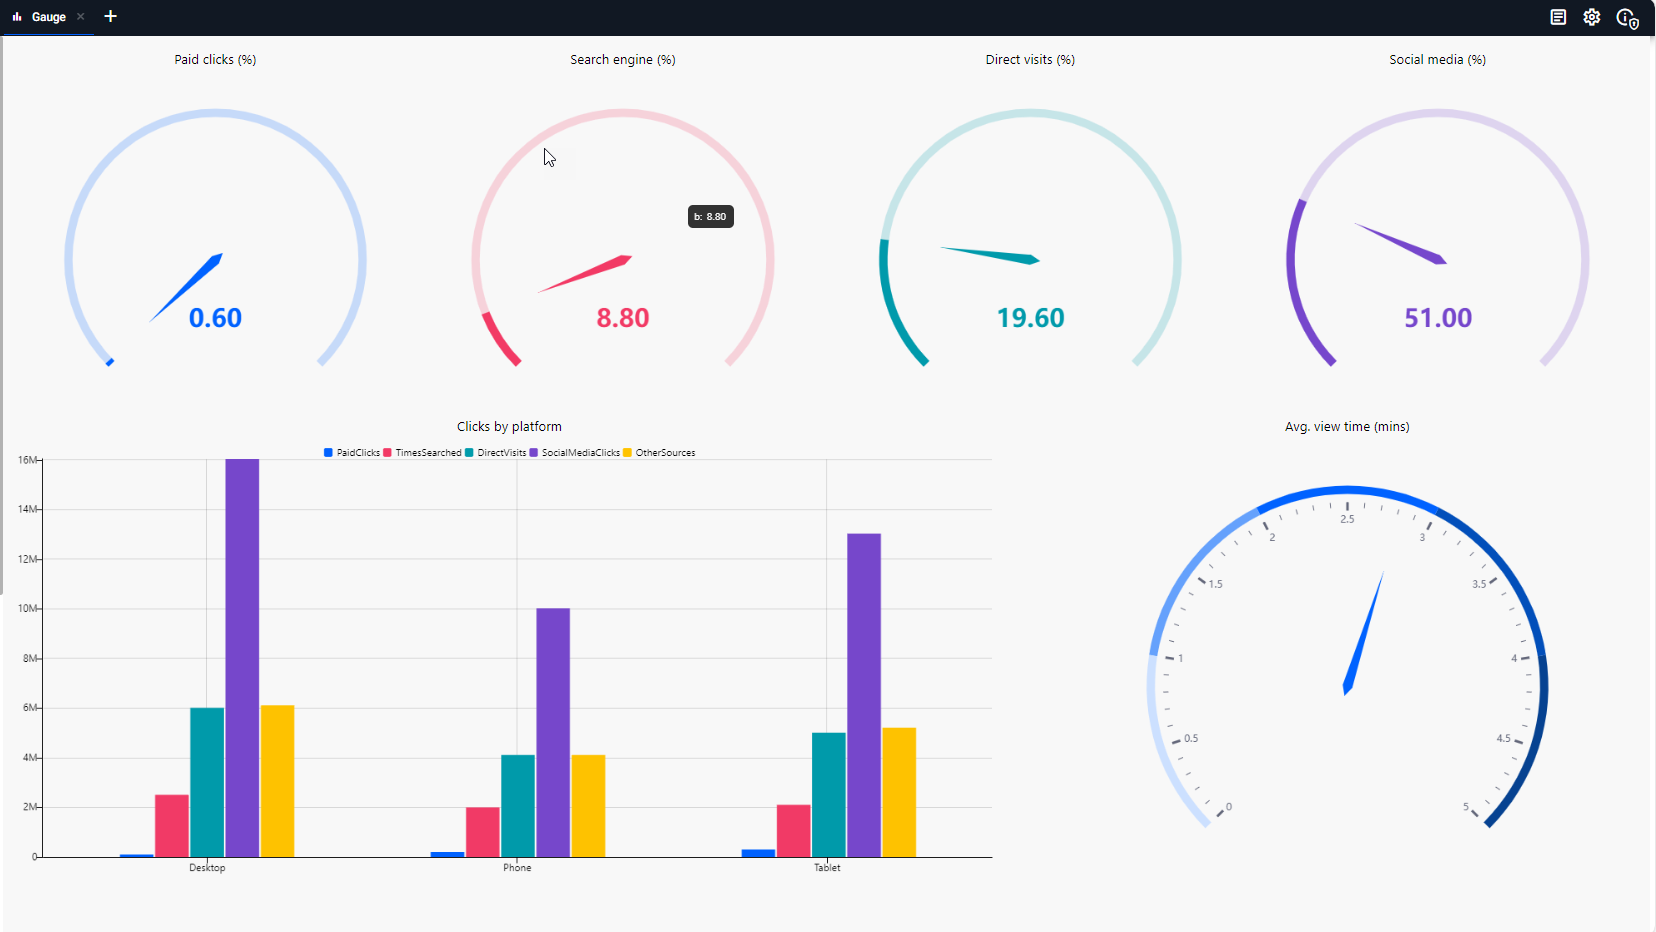
The first tab displayed shows key chart types including:
- Bar & Line Charts: Ideal for trend and comparison analysis across categories or time.
- Bubble & Scatter Plots: Useful for multivariate analysis and identifying correlations or clusters.
- Area Charts: Highlight cumulative values and trends over time.
- Boxplots & Violin Plots: Provide statistical summaries and distribution insights.
- Candlestick Charts: Tailored for financial time series, showing OHLC (Open, High, Low, Close) data.
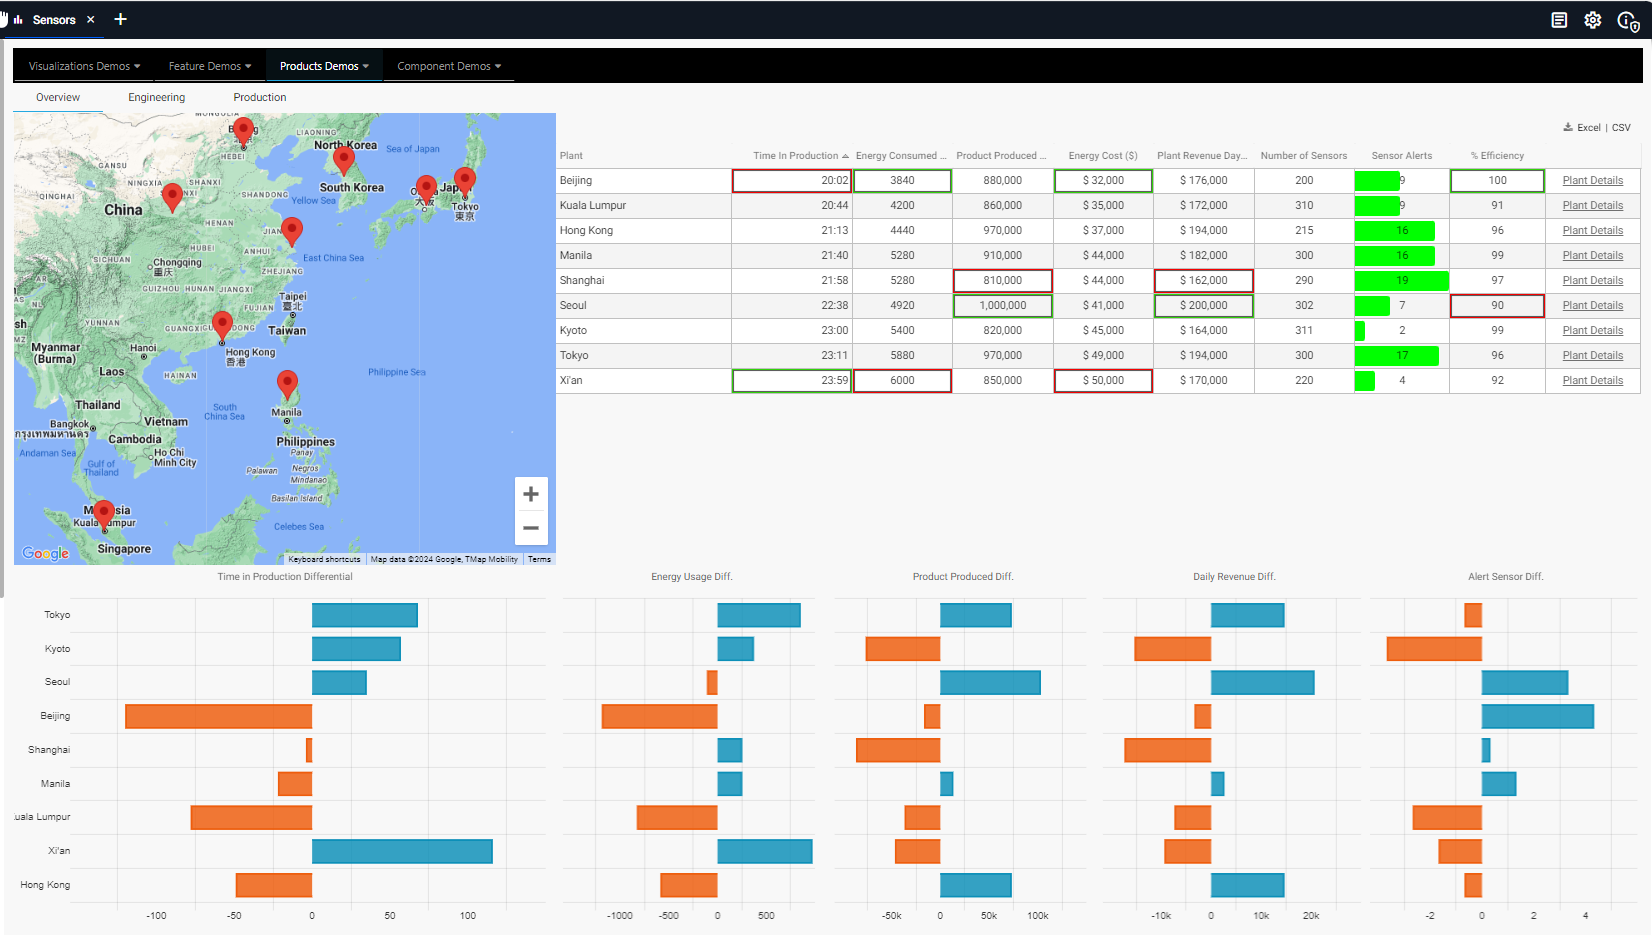
- Click on other tabs to continue to explore this sample dashboard.
Explore the complete set of demo Views to help you understand the full visualization capabilities of kdb Insights Enterprise.
The following pages provide details on how to create and configure Views:
On this page you can see how to access an index of views.
Index of views
Click on Views in the left-hand menu to view a list of all your views.
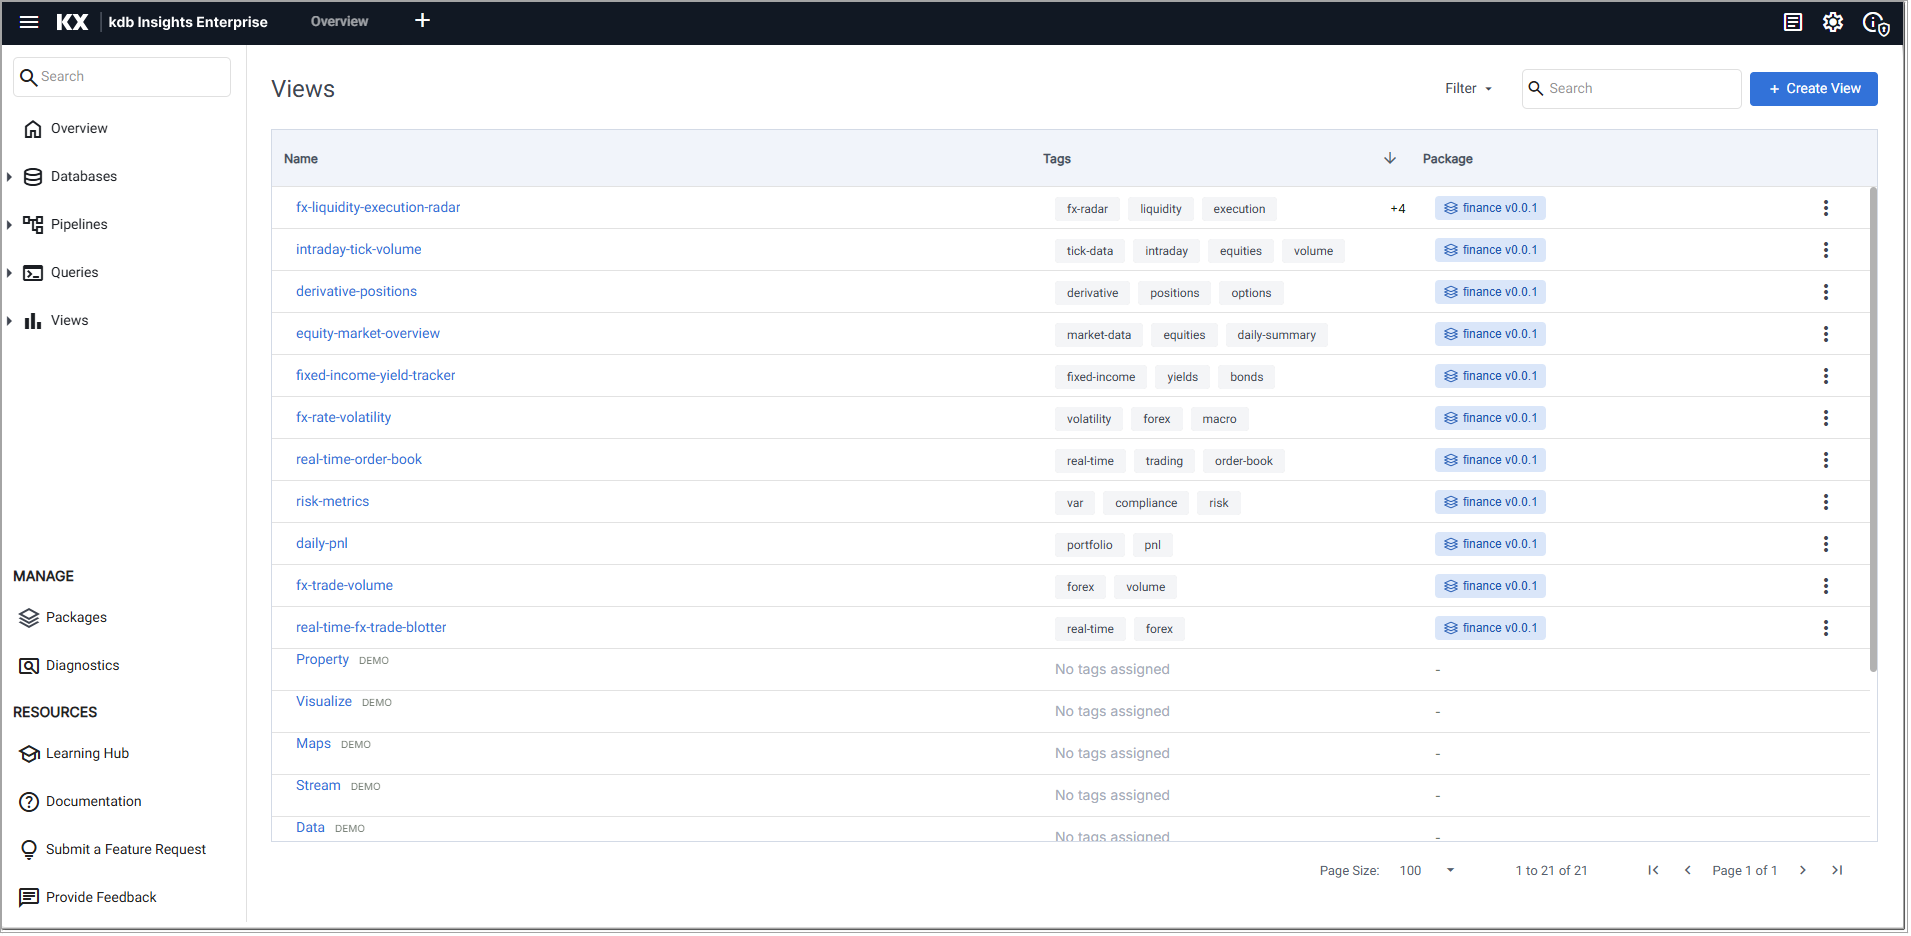
The following details are displayed:
| Column | Description |
|---|---|
| Name | The name of each of the Views. Click on the name to go to the view screen. Views are listed alphabetically and can be reordered by clicking the column name. This listing includes the names of demo views. To filter the list of names click the filter icon and enter a filter value. You can refine your filter further using AND/OR options to add additional criteria. 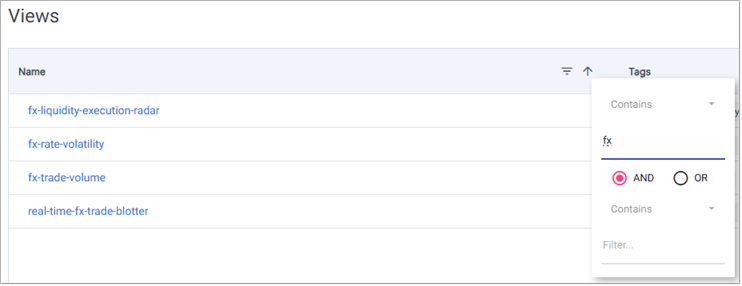 |
| Tag | The tags associated with this view. When the number of Tags exceeds the visible space, a +n indicator appears to show how many additional tags are not currently displayed. Click the number to display the extra tags. 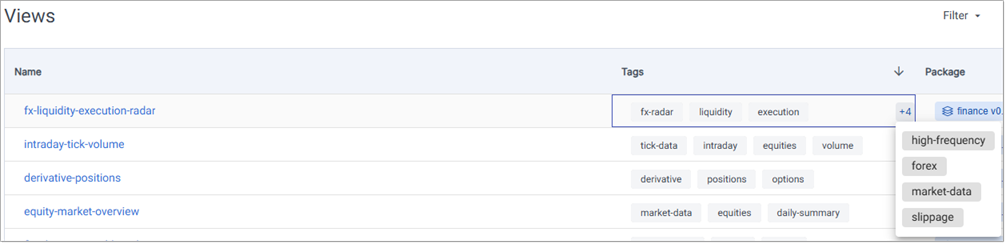 You can sort the contents of the column by clicking the column heading. You can also filter the listing by tag. |
| Package | The name and version of the package that contains this view. |
| ⋮ | The last column contains an action menu represented by a three-dot icon (⋮). This menu provides additional options or actions specific to each row entry. See Actions for details. |
Click Create View to create a new view.
Tags
Tags provide an effective way to organize Views, making them easier to manage and arrange. As the number of Views increases, using tags helps maintain a scalable structure, reducing clutter and confusion. Tags also streamline access and sharing, allowing users to quickly find and share relevant Views without having to sort through unrelated content.
Tags are applied when you create a View or by adding them to existing Views.
Filter Tags
In the Views Index you can filter Views by tags, helping you quickly locate the relevant Views and reduce time spent searching.
-
Click Filter to open the tag filter dropdown. This shows a list of tags applied to the Views you have access to.
- Each tag is accompanied by a checkbox and the number of Views that use it.
- The All Tags option lets you quickly select or deselect all tags at once.
- The No Tags Assigned option lets you exclude untagged Views from the results.
-
Select one or more tags to filter the index.
-
The list of Views updates to show only those that include all selected tags.
-
For example, selecting the
forexandequitiestags filters the index to show only Views containing both.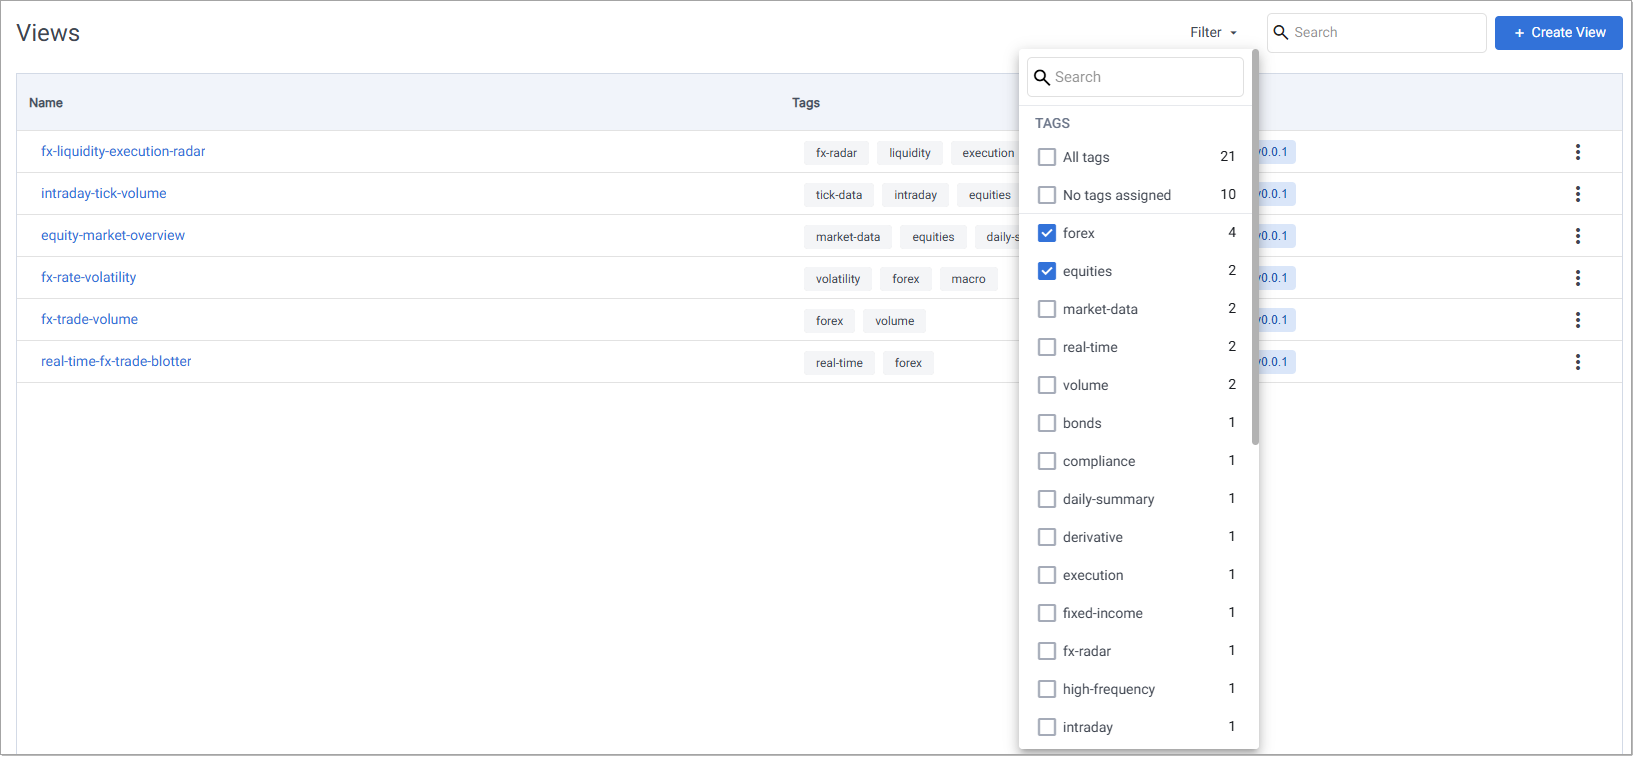
-
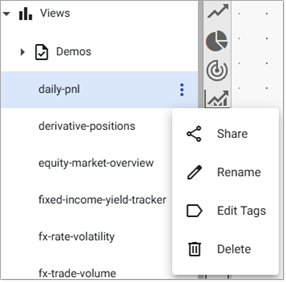
View Actions
From the Views Index or the Views option on the left-hand menu, click on the three dots beside the View name to access the following actions:
Next Steps
- Read the quickstart guide to setting up a view.
- Read the detailed guide to setting up views.
Further reading
The following pages provide guided walkthroughs on creating Views: