Scratchpad
This page describes how to use the Scratchpad panel, in the Query window to query the database, develop and debug pipelines, or run arbitrary q and Python code.
Once you are familiar with the features and layout of the Scratchpad you can proceed with using it to execute the functionality.
Results of your queries can be viewed in the Output Panel at the bottom of the screen.
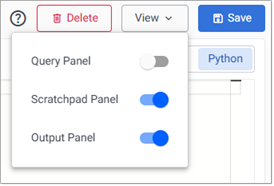
If these panels are not visible, click View, in the top left-hand corner, and toggle Scratchpad Panel and/or Output Panel to display them.
Scratchpad features
A scratchpad is a temporary q process that runs in a Rocky Linux container. Each user has their own scratchpad. While you can save the contents of the editor, any in-memory or on-disk state is only retained until the scratchpad session ends.
This section describes:
Scratchpad resources
The CPU and memory resources for the Scratchpad can be configured within your values.yml. See Scratchpad resources for details. Any changes made to these resources apply to all users.
A Scratchpad is limited (by default) to 500 MiB of RAM and 50 MiB of disk. When exceeded, the Scratchpad process shuts down and restarts. To optimize performance, limit the amount of data returned in your query; for example: select[10000] from myTable to return 10,000 rows of data.
Disk operations
The scratchpad environment includes a 250 MB disk mounted to /tmp that can be used for temporary file storage. This folder is ephemeral, and is cleared when the Scratchpad process terminates due to logout, reset or crash. The rest of the file system is read-only.
For example, if you install Python packages in the Scratchpad; these must be installed to /tmp, which is the only writable location. You must be aware of the disk space limit, as installing packages or writing too much data may exhaust the available space.
Pipelines also use on-disk storage. This means both pipeline quick tests and pipelines written in q or Python can write to /tmp, and excessive usage can trigger a Scratchpad restart.
Scratchpad restart
Scratchpads terminate after one hour of inactivity, or if a resource limit is exceeded. After a Scratchpad restart, any in-memory or on-disk state is lost.
Logs
Each user gets their own Scratchpad. Each Scratchpad is a q process running in a pod. Use kubectl get pod <pod-name> to get information about your Scratchpad pod.
Scratchpad pods are named <release-name>-scratch-<first 7 characters of user name>-<hash> (e.g. insights-scratch-jsmith-c5415851ba45a47c4f7c50bc418dae46-vdhcc).
An example of the output returned when you run kubectl get pod insights-scratch-jsmith-c5415851ba45a47c4f7c50bc418dae46-vdhcc is shown below.
NAME                                                              READY   STATUS    RESTARTS       AGE
insights-scratch-jsmith-c5415851ba45a47c4f7c50bc418dae46-vdhcc    1/1     Running   0              15m
- NAME - The name of the pod (example-pod).
- READY - The number of containers in the pod that are ready (1/1).
- STATUS - The status of the pod (Running).
- RESTARTS - The number of times the pod has been restarted (0).
- AGE - How long the pod has been running (5m).
Scratchpad log capture and retrieval (BETA)
Beta - For evaluation and trial use only
Scratchpad log capture and retrieval currently in beta.
- Refer here to the standard terms related to beta features
- We invite you to use this beta feature and to provide feedback using the Ideas portal
- During deployment, this feature is disabled by default.
The logs written by show statements in q and print statements in Python, as well as messages written to STDERR, are written to a buffer that can be queried. This captures log messages for code run in the scratchpad editor, pipeline editors, and pipelines deployed using quick test. It does not include show statements in qsql database queries or UDAs.
Known issue with large log volumes
There is a known issue where large log volumes, such as writing over 100,000 bytes at a time or continuous logging at over 5,000 bytes a second can cause the scratchpad to hang. As such this is still a beta feature, and must be explicitly enabled by running the q command .com_kx_edi.cacheLogs[].
Using show or 0N! rather than the file handles 1 and 2 when logging in q can help avoid this bug, as they limit the length of each line, and the number of rows.
- Logged messages are not available in the query that generates them, but are available in subsequent queries, with a slight delay for large messages.
q)show `Hello`; .com_kx_edi.getLogs[] () q).com_kx_edi.getLogs[] "`Hello" - When the log buffer reaches one million characters, the oldest half is discarded.
Enable log capture and retrieval
This is a beta feature and is disabled by default. If you attempt to capture or retrieve logs while it is disabled an error is displayed.

To enable this feature, enter .com_kx_edi.cacheLogs[] in the Scratchpad, as shown below.
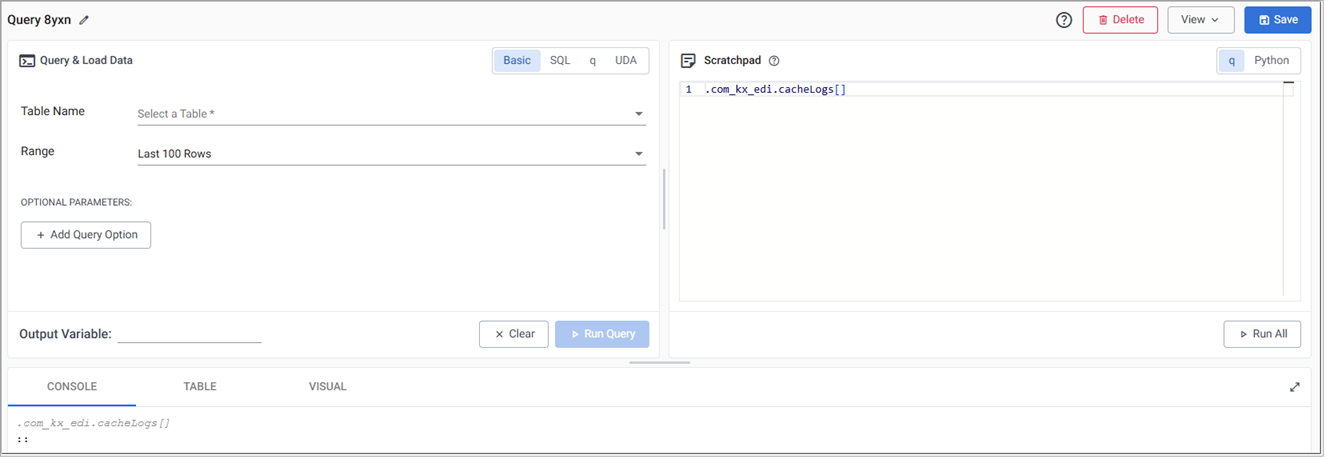
If the Scratchpad resets the logging feature has to be re-enabled.
Capture output written to STDOUT and STDERR
To use this feature, enter the appropriate command in the Scratchpad panel. Commands can be written in either q or Python.
| Command | Description |
|---|---|
.com_kx_edi.getLogs[] |
Get all STDOUT and STDERR logs for the scratchpad process from the time that logging is enabled. |
.com_kx_edi.clearLogs[] |
Clear all STDOUT and STDERR logs. |
| Command | Description |
|---|---|
scratchpad_logs.get_logs() |
Get all STDOUT and STDERR logs for the scratchpad process from the time that logging is enabled. |
scratchpad_logs.clear_logs() |
Clear all STDOUT and STDERR logs. |
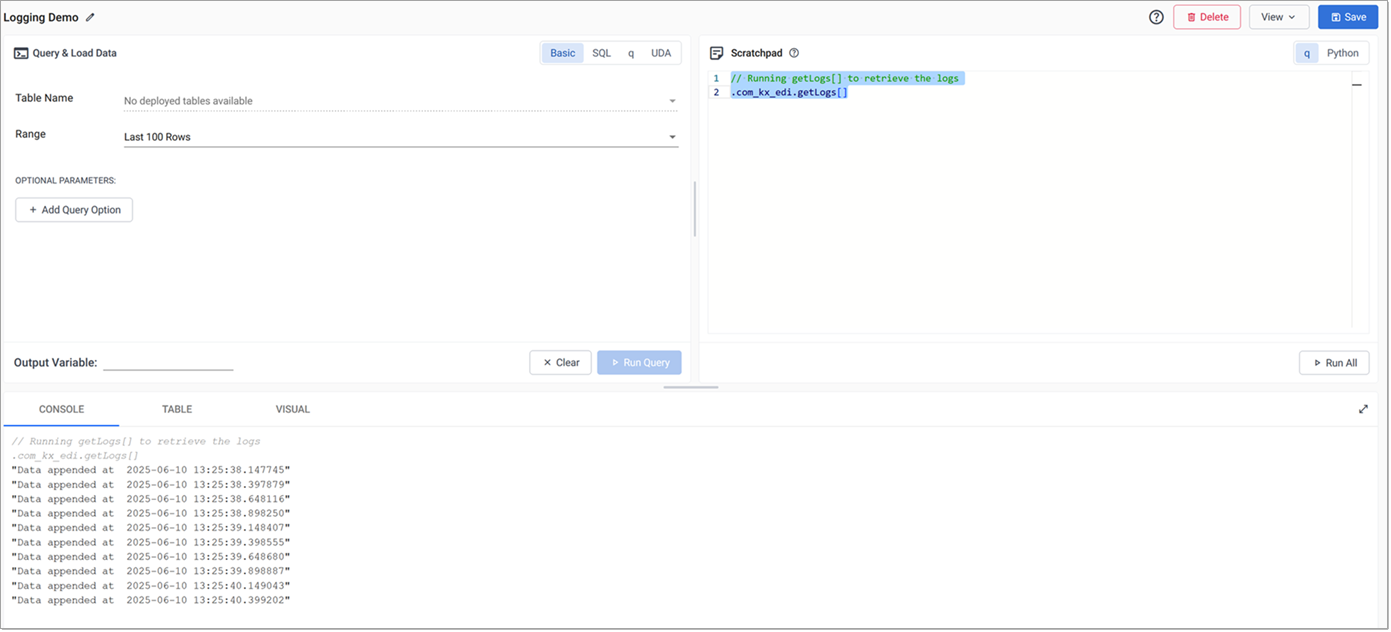
The following example demonstrates how to run getlogs using the q syntax. Enter the command in the Scratchpad, then click CTRL+D to display the results in the Console.
Keycloak Permissions
The following Scratchpad roles are available for fine-grained permissions.
| Role | Description |
|---|---|
| insights.scratch.display | Evaluating q and Python expressions, and displaying or visualizing the results |
| insights.scratch.data | Querying a database using the query builder. |
| insights.scratch.sql | Querying a database SQL. |
| insights.scratch.qsql | Querying a database using the qsql. |
| insights.scratch.pipeline.test | Running "Quick Test" pipelines in the Scratchpad |
See keycloak permissions for further details on roles.
Scratchpad Layout
The Scratchpad is the top right-hand section of the Query window.
If this panel is not visible, click View, in the top of the window, and toggle Scratchpad Panel to display it.
This panel is comprised of the following elements:
-
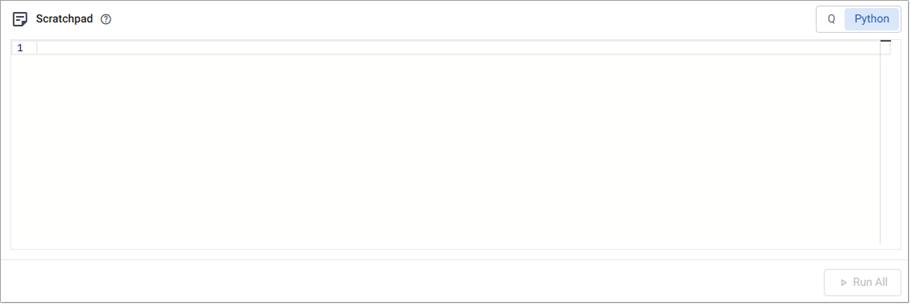
Editor - The Scratchpad is a scrollable editor window used to enter your code. The 2 tabs at the top right-hand corner of the window allow you to toggle between q and Python editors.
-
Run All - This button is used to run all the code entered in the editor. The output is displayed in the tabs below the editor. To run only the current line or highlighted selection, use Ctrl + D or Ctrl + Enter on Windows, or ⌘Enter or ⌘E on mac.
Hotkey for quick access to documentation
The scratchpad supports using the Ctrl+/ hotkey to open documentation related to the selected operators, keywords, and values within single-letter namespaces.
Firefox Users
If you’re having trouble scrolling in the Scratchpad while using Firefox, make sure that scrollbars are set to always be visible.
Scratchpad functionality
The Scratchpad supports the following:
- Creating ad hoc queries
- Viewing query results
- Developing and running q code in a Scratchpad
- Developing and running python code in a Scratchpad
- Use query APIs to interact with the database
- VSCode Integration
Create ad hoc queries in Scratchpad
To perform an ad hoc query using the Scratchpad:
- Create a query using the Query panel.
-
When analyzing the data retrieved from your kdb Insights Enterprise database, you can use either q or Python.
Click on either the q or Python tab on the Scratchpad, depending on your language preference and enter your query. Note that when you use Python, only the first line of code is processed.
The following example shows a query which returns the results to an output variable called weather. This variable is then used in the q query in the Scratchpad to perform a further ad hoc query to refine the results.
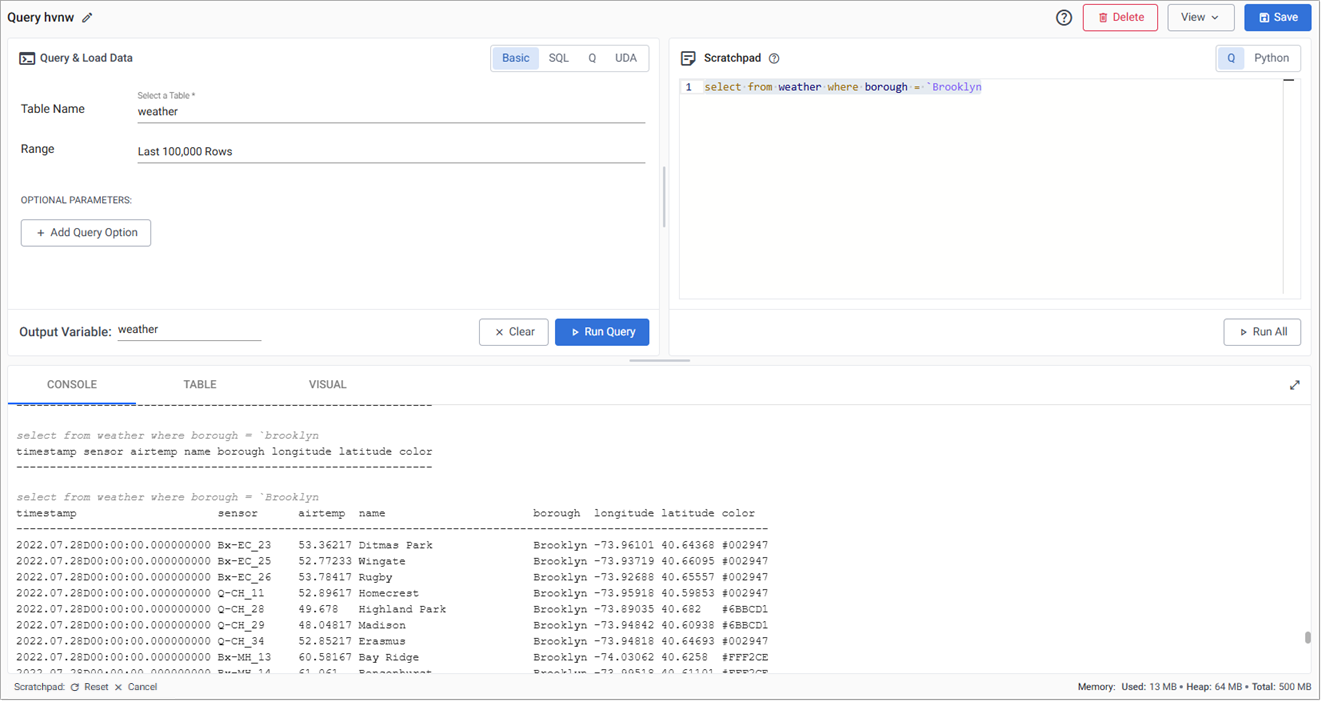
-
Click Run All.
- View and analyze the results in the output panel.
Running Queries
Running a selected line of code context is set by preceding lines, similar to \d .myContext or system "d .myContext". The global context is used in the absence of a preceding line.
Read more about using q and Python in your queries.
Query output
Clicking Run Query in the Query Panel, or Run All in the Scratchpad, returns the results of data queried using the Query panel or by ad hoc queries in the Scratchpad. You can view these results in one of the tabs at the bottom of the Query Window:
If this panel is not visible, click View, in the top left-hand corner, and toggle Output Panel to display it.
By default, data is displayed in the Console tab. To display the results in another tab, switch the tab you want and click Run Query again and Run All if you have an ad-hoc query.
Expand Output display
To expand the output panels to full screen:
-
Click the icon in the top right-hand corner of the output panels.
When the panel is expanded, all other panels on the Query window are hidden.
To restore the output panel to normal size:
-
Click the icon in the top right-hand corner of the expanded window.
This restores the view of the other panels.
The following example shows how to use the expand icon on the Table panel.
Reset or cancel a query
To reset or cancel a query in the Query Panel or Scratchpad, click Reset or Cancel in the bottom-left corner of the window.
- Reset restarts the scratchpad process, clearing the entire scratchpad state including any variables you have defined in q or Python. Use this to reset an unresponsive scratchpad, free up memory, recover from accidental overwrites, or ensure your code runs without relying on previously defined global variables. Note that it take ups to 30 seconds for the scratchpad ton become responsive after restarting.
- Cancel applies to the operation the scratchpad is currently processing, whether that is a DB query, scratchpad query, test deploy, or even a query from VS Code or a different browser.
Reset and cancel both clear all pending scratchpad operations. This ensures that if a problematic request was sent repeatedly, restarting the scratchpad won’t immediately re-enter the same faulty state.
Cancelled database queries may continue running on the database for up to thirty seconds.
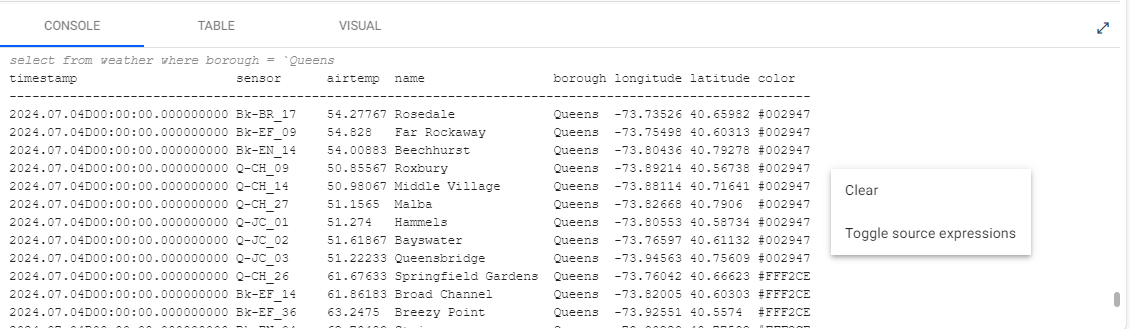
Console
The console is the default display for query output. Right-click in the console for additional options.
These options are described in the following table.
| Option | Description |
|---|---|
| Clear | Clears the console. |
| Toggle Source Expressions | Toggles the display of the code expression in the console. |
Table
The Table tab is a more structured display for query output with additional filter options. Results are paged and you can filter them.
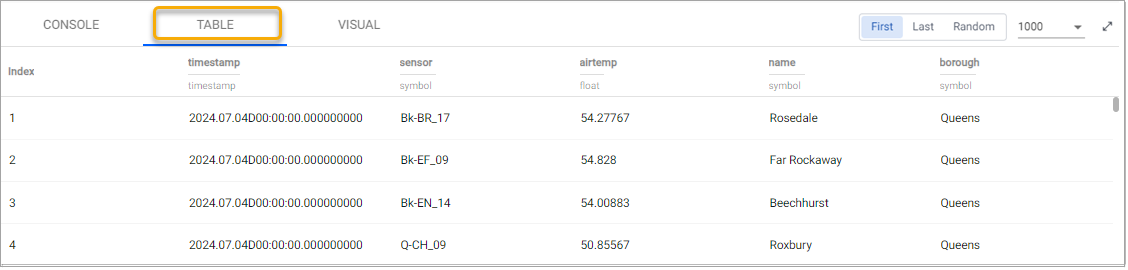
| Setting | Description |
|---|---|
| First | Display the first n items. n depends on the number selected from the # of results drop-down. |
| Last | Display the last n items. n depends on the number selected from the # of results drop-down. |
| Random | Display a random selection of items, without replacement. |
| # of results drop-down | Select how many first items to display (10, 100, 1000, or 10,000). |
To view results, you can either:
- Click Run All on the Scratchpad
- Click Ctrl-Enter or Ctrl-D in the main q or Python editor to execute the current line or selection
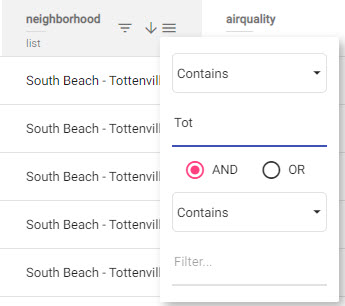
Column Filter
Data columns, in the Table view can be sorted in ascending and descending order by clicking on the column header.
Additional filtering options are available from the triple-bar menu, above the data.
- Use AND/OR statements alongside operators Contains, Not contains, Equals, Not equal, Starts with, or Ends with for more comprehensive filtering.
- For example, the results below are filtered on the neighborhood column where it Contain the value Tot. Filter criteria can be combined using AND and OR.
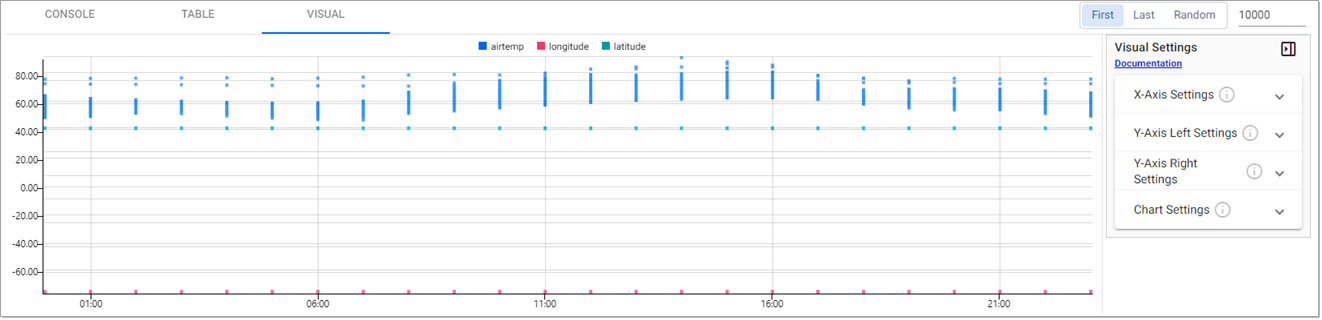
Visual
The Visual tab plots query output as a chart.
- You can choose between Bubble, Line or Bar charts, from the y-axis settings .
- Visual settings give you options to configure the features of your chart.
The following example shows query results displayed in a bubble chart.
The following table defines the data display options:
| Setting | Description |
|---|---|
| First | Displays results from the start of the data source (page 1). |
| Last | Displays results from the end of the data source (last page). |
| Random | Selects a random point in the data set to display results. |
| # of results drop-down | This drop-down list lets you filter paged results by one of these number of pages results per page. |
Visual Settings
You can define the following settings using the Visual settings menu. Click the toggle button to display/hide the settings menu, and click on each setting to expand the options available.
X-Axis settings
The X Axis Settings define the x-axis data variables to chart and how they are formatted and displayed.
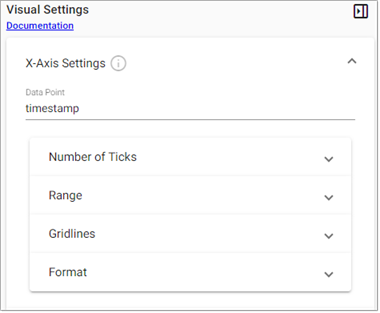
These following settings are configurable:
- Data Point: The data column to plot on the x-axis of the chart. Select from the dropdown to change the value.
- Number of Ticks: The number of tick labels to display in the x-axis.
- Range
- Gridlines
- Format
Range
| Setting | Description | Default |
|---|---|---|
| Use min max | Enable the use of Min and Max to build the axis. If these are unchecked the Min and Max values, set below, are ignored. | Disabled |
| Min | Define the minimum value for the axis. | |
| Max | Define the maximum values for the axis. Charted data outside of the set Min and Max range is not displayed. If all data falls outside the set range, the chart is blank. |
Gridlines
| Setting | escription | Default |
|---|---|---|
| Offset Gridlines | When enabled, sets gridlines between tick values. | Disabled |
| Gridlines Color | Set the color of the gridlines used in the chart. | #000000 |
| Gridlines Opacity | Defines the opacity of gridlines from 0 (transparent) to 100 (opaque). |
15 |
Format
| Setting | Description | Default |
|---|---|---|
| Display | When enabled (for x-axis), displays tick values. | Enabled for x-axis. |
| Begin at Zero | When enabled, plotted values start at 0 for the x or y-axis. | Disabled |
| Numeric Format | Select between Number, Smart Number and Formatted Number. | Numeric |
| Decimal Places | Define precision of y-axis labels. | 2 |
| Font size | Define font-size of tick labels. | 12 |
| Prefix | Add a text element before the y-axis label. | |
| Suffix | Add a text element after y-axis tick label. | |
| Hide Trailing Zeroes | When enabled, trailing zeroes are hidden from axis labels. | Disabled |
Y-Axis Settings
The left and right Y Axis Settings define the data variables to chart and how they are formatted and displayed.
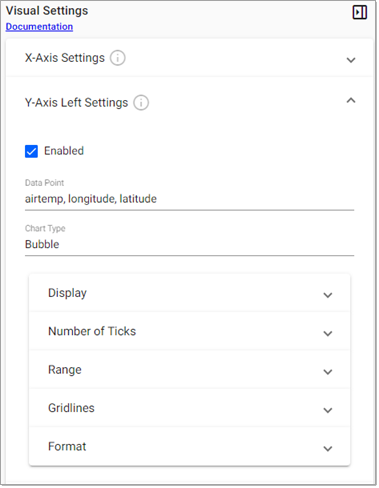
These following settings are configurable:
- Enabled: The left y-axis is enabled by default. The right y-axis is disabled by default. Enable it to have two y-axes on your chart.
- Data Point: The data columns to plot on this y-axis of the chart. Select single or multiple columns from the dropdown to change the value.
- Chart Type: Select from one of the following chart types; Bubble, Line or Bar. You can set a different chart type for the left and right y-axis. You can configure the following settings, for each chart type:
Display
The Display settings vary based on the chart type selected. The following screenshot shows the Display settings for a Bubble chart.
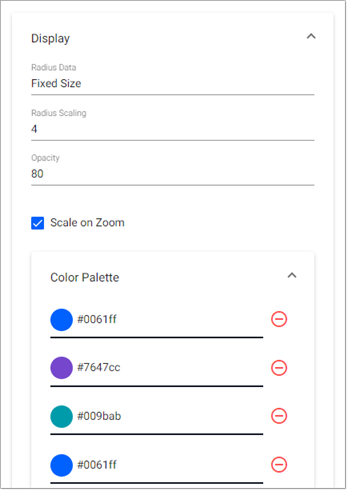
The following table describes the Display settings and indicates the chart types they apply to.
| Setting | Description | Bubble | Bar | Line |
|---|---|---|---|---|
| Radius Data | Choose between a data source variable or Fixed Size bubbles. | y | ||
| Radius Scaling | Set bubble size. | y | ||
| Color | Set the color of the bubble, bar, or line. | y | y | y |
| Opacity | Set the opacity of the bubble, bar, or line in the range 0 (transparent) to 100 (opaque). | y | y | y |
| Fill | Enable to fill the area of the line to the origin of the x-axis. | y | ||
| Scale on Zoom | Enable this option for bubbles to scale on zoom. When set the bubble size increases in size on zoom in and decreases on zoom out. | y | ||
| Bar Percentage | Toggle between Percentage or Fixed Width for bar width. | y |
Color Palette
Use the Color Palette settings to set the color for data points on the chart. Click on a color to change it or enter a Hex color value.
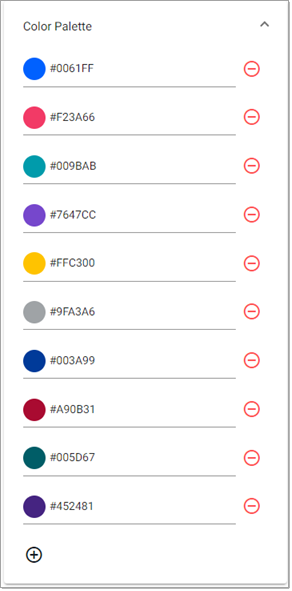
Chart Settings
The Chart Settings define crosshair and overlay behaviors.
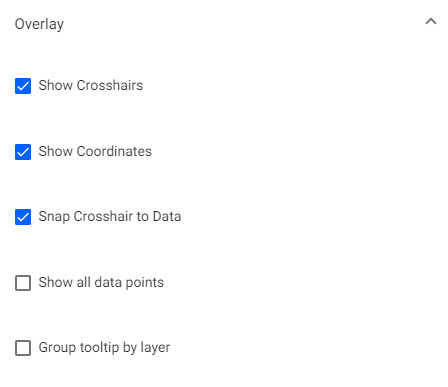
These settings are described in the following table.
| Setting | Description | Default |
|---|---|---|
| Show Crosshairs | When enabled, this adds a crosshair to the chart. | Enabled |
| Show Coordinates | When enabled, this displays axis values for cursor position in chart. | Enabled |
| Snap Crosshair to Data | When enabled, the Crosshair position locks to the y-axis value relative to x-axis position. | Enabled |
| Show all data points | When enabled, the Crosshair displays all values in a tooltip at the x-axis position. | Disabled |
| Group tooltip by layer | When enabled, the display of chart values is grouped in the tooltip by data layers. | Disabled |
VSCode Integration
To work with existing code bases, versioned code, and to easily organize your code, the KX extension for VS Code extension offers an alternative to the Insights Scratchpad Web Interface. This allows you to connect to the same q Scratchpad process accessible from the web interface, so all variables are shared between the two interfaces. It supports evaluating q (from .q, or .quke files) or Python (from .py files). The same options for querying the database are available from the extension.
Next Steps
- Perform further analysis and development in the Scratchpad using q
- Perform further analysis and development in the Scratchpad using python
- Create advanced Visualizations