RAM Capacity Reporting
This page explains the requirements for self-managed customers to report RAM capacity to KX.
The self-service licensing model previously in use for KX products has been deprecated. Contact your sales representative if you have questions about this, and wish to discuss moving to the new model.
In environments where KX software is licensed based on the provisioned RAM capacity, KX requires that self-managed commercial customers audit their RAM capacity for their deployment type, to comply with the KX Software Usage Terms.
The methods for auditing RAM capacity are described in the following sections:
If an environment is not formally containerized, the recommendation is to formally containerize or use Control Groups (cgroups) so that the provisioned RAM capacity for KX processes can be limited to them. Otherwise, the full RAM available to the environment is used as the measure.
Self-managed customers are required to run the reporting to gather max RAM capacity. To assist in this reporting, guidance below describes how to extract the RAM capacity for each target environment.
Tip
The scripts provided below are examples, and may need adaptation for your deployment environment, including where cgroups have been set up outside of the context of full orchestration.
Please refer to the links in this page for guidance and raise a ticket on the support portal for assistance in setting this up, if required.
Obligations for self-reporting customers on existing arrangements remain unchanged.
Physical hosts/ named VMs
The method used to extract your provisioned RAM depends on the operating system as described in the following examples.
Unix
Run free -m in a shell session and review the output. For example:

Record total as the provisioned RAM.
Windows
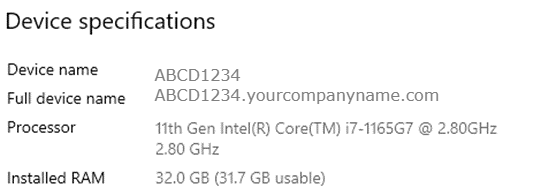
In Windows, go to: Control Panel > System & Security > System > Installed RAM.
Record the Installed RAM as the provisioned RAM.
macOS
Navigate to: Activity Monitor > Memory > Physical Memory.
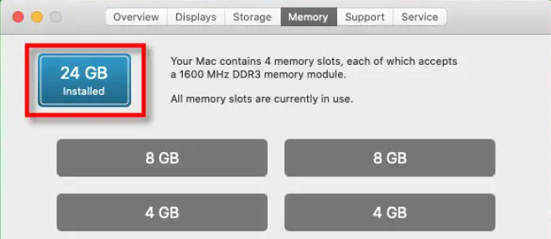
Record the RAM displayed as the provisioned RAM, in this example, 24 GB.
Orchestrated environments
Overview
For Kubernetes and Docker orchestrated environments, the required information may be extracted using the sample scripts described below. The scripts are examples provided as a starting point and can be adapted to fit your deployment topology; any adaptation to the reporting methodology must be reviewed and approved by KX before use for official reporting.
Reporting method
Metrics recorded. For each running container, the report attempts to record three memory metrics and the server it runs on, writing one row per container to a timestamped CSV:
- Cgroup peak (optional) — the container's peak memory, read from its cgroup (
memory.peakon cgroup v2,memory.max_usage_in_byteson cgroup v1). - Container limit (optional) — the container's configured memory limit.
- Node/server capacity (required) — the total memory of the server.
Note
For some containers the cgroup peak is unavailable, for example those with no shell (distroless) or where the metric cannot be read. Where this happens, KX applies the following fallback order when calculating usage: cgroup peak, then container limit, then node/server capacity.
Frequency. Run the script as described in the KX Software Usage Terms, which define the RAM measurement period and cadence. Each run produces one timestamped CSV.
Kubernetes
Prerequisites
- Python 3, with the
kubernetespackage installed (for example, viapip install kubernetes). - A kube context with permission to
listpods,getnodes, andcreateon thepods/execsubresource (i.e. exec into containers).
Script
extract-ram-kubernetes.py attempts to record, for each running container in the given namespaces, the memory metrics and the node it runs on. Pass the namespaces your deployment uses (at least one is required). For Insights Enterprise, see Insights Enterprise namespaces.
By default the current kube context is used; pass --context to use a different one. Pass --no-exec to skip the cgroup peak reading (no exec into containers) and report only the container limit and node capacity.
Save the following script as extract-ram-kubernetes.py:
#!/usr/bin/env python3
"""
Sample RAM report for Kubernetes deployments.

For each running container in the given namespaces, attempts to record three
memory metrics and the node it runs on, writing one row per container to a
timestamped ram-extract-YYYYMMDDThhmmssZ.csv (UTC) in the current directory:

  * Cgroup Peak (GiB)     - optional - the container's peak memory, read from its cgroup (`memory.peak` on cgroup v2, `memory.max_usage_in_bytes` on cgroup v1).
  * Container Limit (GiB) - optional - the container's configured memory limit.
  * Node Capacity (GiB)   - required - the total memory of the node it runs on.

Namespaces are required and differ by deployment. For Insights Enterprise, use
the set for your version (see the KX RAM reporting documentation); for other
deployments, use the namespaces you deployed into.

Usage:    python3 extract-ram-kubernetes.py [--context CONTEXT] [--no-exec] [--debug] <namespace> [namespace ...]

Requires: the `kubernetes` package (for example, pip install kubernetes), and a kube
          context with permission to list pods, get nodes, and exec into
          containers (pods/exec).
"""

import argparse
import csv
import logging
import sys
import uuid
from datetime import datetime, timezone

from kubernetes import client, config
from kubernetes.stream import stream
from kubernetes.utils import parse_quantity

RUNID = str(uuid.uuid4())


def k8s_mem_to_gib(mem):
    """Convert a Kubernetes memory quantity (e.g. 512Mi, 4Gi, 1.5Gi, 128e6) to GiB."""
    if not mem:
        return None
    try:
        return float(parse_quantity(mem)) / 1024**3
    except ValueError:
        logging.warning("Could not parse memory quantity %r", mem)
        return None


def cgroup_peak_gib(v1, pod, namespace, container_name):
    """
    Peak memory from the container's cgroup via a single exec.
    Returns the value in GiB, or None if unavailable (distroless / no shell / no
    peak file). A genuine 0 is returned as 0.0.
    """
    script = (
        'T=$(stat -fc %T /sys/fs/cgroup/ 2>/dev/null) || exit 1;'
        'if [ "$T" = "cgroup2fs" ]; then V=$(cat /sys/fs/cgroup/memory.peak 2>/dev/null);'
        'else V=$(cat /sys/fs/cgroup/memory/memory.max_usage_in_bytes 2>/dev/null); fi;'
        'printf "%s|%s" "$T" "$V"'
    )
    try:
        output = stream(
            v1.connect_get_namespaced_pod_exec,
            pod, namespace,
            container=container_name,
            command=["/bin/sh", "-c", script],
            stdout=True, stderr=False, stdin=False, tty=False
        )
    except Exception as e:
        logging.warning("cgroup peak: exec failed for %s/%s/%s: %s", namespace, pod, container_name, e)
        return None

    if not output or "|" not in output:
        logging.debug("cgroup peak: no reading for %s/%s/%s", namespace, pod, container_name)
        return None

    raw_bytes = output.strip().split("|")[-1]
    if not raw_bytes.isdigit():
        return None

    return int(raw_bytes) / (1024 ** 3)


def container_limit_gib(pod, container_name):
    """The container's configured memory limit in GiB, or None if not set."""
    for c in pod.spec.containers:
        if c.name == container_name and c.resources and c.resources.limits:
            return k8s_mem_to_gib(c.resources.limits.get("memory"))
    return None


_node_capacity_cache = {}


def node_capacity_gib(v1, node_name):
    """Total memory capacity of the node in GiB (cached per node), or None."""
    if not node_name:
        return None
    if node_name not in _node_capacity_cache:
        try:
            node = v1.read_node(node_name)
            _node_capacity_cache[node_name] = k8s_mem_to_gib(node.status.capacity.get("memory"))
        except Exception:
            _node_capacity_cache[node_name] = None
    return _node_capacity_cache[node_name]


def parse_args():
    parser = argparse.ArgumentParser(description="Sample RAM report for Kubernetes deployments.")
    parser.add_argument("namespaces", nargs="+", help="Namespaces to report on (at least one).")
    parser.add_argument("--context", help="Kubeconfig context to use (default: current context).")
    parser.add_argument(
        "--no-exec", action="store_true",
        help="Skip the cgroup peak reading (no exec into containers); report only the container limit and node capacity.",
    )
    parser.add_argument("--debug", action="store_true", help="Enable debug logging.")
    return parser.parse_args()


def main():
    args = parse_args()
    logging.basicConfig(level=logging.DEBUG if args.debug else logging.INFO)

    namespaces = args.namespaces
    logging.info("Run %s", RUNID)

    try:
        config.load_kube_config(context=args.context)
    except Exception as e:
        logging.error("Could not load Kubernetes config: %s", e)
        sys.exit(1)
    v1 = client.CoreV1Api()

    # Collect all running pods first, so a missing node capacity aborts before
    # any report file is created.
    logging.info("[1/3] Fetching running pods for namespace(s): %s", ", ".join(namespaces))
    namespace_pods = []
    for namespace in namespaces:
        try:
            pods = v1.list_namespaced_pod(namespace, field_selector="status.phase=Running")
        except Exception as e:
            logging.error("  %s: could not list pods: %s; aborting.", namespace, e)
            sys.exit(1)
        logging.info("  %s: %d pod(s)", namespace, len(pods.items))
        namespace_pods.append((namespace, pods.items))

    node_names = {pod.spec.node_name for _, pods in namespace_pods for pod in pods if pod.spec.node_name}
    logging.info("[2/3] Checking memory capacity for %d node(s)", len(node_names))
    for node_name in node_names:
        if node_capacity_gib(v1, node_name) is None:
            logging.error("  %s: could not determine memory capacity; aborting.", node_name)
            sys.exit(1)
        logging.debug("  %s: memory capacity OK", node_name)

    total_containers = sum(len(pod.spec.containers) for _, pods in namespace_pods for pod in pods)
    logging.info(
        "[3/3] Checking memory for %d container(s) across %d pod(s)%s",
        total_containers, sum(len(pods) for _, pods in namespace_pods),
        " (cgroup peak skipped, --no-exec)" if args.no_exec else "",
    )

    filename = f"ram-extract-{datetime.now(timezone.utc).strftime('%Y%m%dT%H%M%SZ')}.csv"
    rows = 0
    no_peak = 0
    with open(filename, "w", newline="") as f:
        writer = csv.writer(f)
        writer.writerow([
            "RunId", "Date/Time", "Node", "Namespace", "Pod", "Container",
            "Cgroup Peak (GiB)", "Container Limit (GiB)", "Node Capacity (GiB)",
        ])

        for namespace, pods in namespace_pods:
            logging.info("  %s: checking %d pod(s)", namespace, len(pods))
            for pod in pods:
                pod_name = pod.metadata.name
                node_name = pod.spec.node_name
                node_cap = node_capacity_gib(v1, node_name)

                for container in pod.spec.containers:
                    datetime_str = datetime.now(timezone.utc).strftime("%Y-%m-%dT%H:%M:%SZ")

                    logging.debug("    checking %s/%s/%s", namespace, pod_name, container.name)
                    if args.no_exec:
                        cgroup = None
                    else:
                        cgroup = cgroup_peak_gib(v1, pod_name, namespace, container.name)
                        if cgroup is None:
                            no_peak += 1
                    limit = container_limit_gib(pod, container.name)

                    writer.writerow([
                        RUNID, datetime_str, node_name, namespace, pod_name, container.name,
                        cgroup if cgroup is not None else "",
                        limit if limit is not None else "",
                        node_cap if node_cap is not None else "",
                    ])
                    rows += 1

    logging.info("Wrote %d row(s) to %s (%d without a cgroup peak reading)", rows, filename, no_peak)
    if rows and no_peak == rows and not args.no_exec:
        logging.warning("No container returned a cgroup peak; check exec permissions and that the cgroup files are readable.")


if __name__ == "__main__":
    main()
Output
The script writes one row per container, and every row from a single run shares the same RunId. Memory values are in GiB, written as the script calculates them, without rounding. The following extract shows representative rows, including containers whose cgroup peak was unavailable:
| RunId | Date/Time | Node | Namespace | Pod | Container | Cgroup Peak (GiB) | Container Limit (GiB) | Node Capacity (GiB) |
|---|---|---|---|---|---|---|---|---|
e856ff29-64e9-470c-bf8f-e035c25e9cb4 |
2026-09-09T16:05:21Z |
ip-10-0-1-11.us-east-1.compute.internal |
cert-manager |
cert-manager-cainjector-7fc5bf87cd-rvfs9 |
cert-manager-cainjector |
30.649002075195312 | ||
e856ff29-64e9-470c-bf8f-e035c25e9cb4 |
2026-09-09T16:05:26Z |
ip-10-0-2-22.us-east-1.compute.internal |
insights |
cnpg-database-1 |
postgres |
0.39099884033203125 | 0.390625 | 30.649002075195312 |
e856ff29-64e9-470c-bf8f-e035c25e9cb4 |
2026-09-09T16:05:29Z |
ip-10-0-3-33.us-east-1.compute.internal |
insights |
insights-aggregator-0 |
aggregator |
0.09299850463867188 | 2.0 | 30.649002075195312 |
e856ff29-64e9-470c-bf8f-e035c25e9cb4 |
2026-09-09T16:05:29Z |
ip-10-0-3-33.us-east-1.compute.internal |
insights |
insights-aggregator-0 |
aggregator-sidecar |
0.05699920654296875 | 0.125 | 30.649002075195312 |
e856ff29-64e9-470c-bf8f-e035c25e9cb4 |
2026-09-09T16:05:30Z |
ip-10-0-1-11.us-east-1.compute.internal |
insights |
insights-api-gateway-75c98fc5cc-h82wd |
api-gateway |
0.25 | 30.649002075195312 | |
e856ff29-64e9-470c-bf8f-e035c25e9cb4 |
2026-09-09T16:05:31Z |
ip-10-0-2-22.us-east-1.compute.internal |
insights |
insights-keycloak-0 |
keycloak |
0.7120018005371094 | 2.0 | 30.649002075195312 |
e856ff29-64e9-470c-bf8f-e035c25e9cb4 |
2026-09-09T16:05:38Z |
ip-10-0-3-33.us-east-1.compute.internal |
nginx-community |
nginx-community-nginx-ingress-controller-2lqft |
nginx-ingress |
0.048999786376953125 | 0.5 | 30.649002075195312 |
Insights Enterprise namespaces
The namespaces to report on for Insights Enterprise depend on the version:
| Insights Enterprise version | Namespaces |
|---|---|
| 1.19 onwards | cert-manager insights kxi-management kxi-operator cnpg-system nginx-community |
| 1.17 and 1.18 | cert-manager insights kxi-management kxi-operator cnpg-system nginx-community ingress-nginx |
| 1.16 and earlier | cert-manager insights kxi-management kxi-operator ingress-nginx |
# Example: Insights Enterprise 1.19 onwards
python3 extract-ram-kubernetes.py \
  cert-manager insights kxi-management kxi-operator \
  cnpg-system nginx-community
Docker
Prerequisites
- Python 3, with the
dockerpackage installed (for example, viapip install docker). - A Docker context with access to the Docker daemon (for example, socket or remote API access) sufficient to list, inspect, exec into containers, and read host info.
Script
extract-ram-docker.py attempts to record, for each running container on the host, the same memory metrics, with Node set to the Docker host and Container to the container name.
By default the current Docker context is used; pass --context to use a different one. Pass --no-exec to skip the cgroup peak reading (no exec into containers) and report only the container limit and host capacity.
Save the following script as extract-ram-docker.py:
#!/usr/bin/env python3
"""
Sample RAM report for Docker deployments.

For each running container on the host, attempts to record three memory
metrics and the host it runs on, writing one row per container to a
timestamped ram-extract-YYYYMMDDThhmmssZ.csv (UTC) in the current directory:

  * Cgroup Peak (GiB)     - optional - the container's peak memory, read from its cgroup (`memory.peak` on cgroup v2, `memory.max_usage_in_bytes` on cgroup v1).
  * Container Limit (GiB) - optional - the container's configured memory limit.
  * Node Capacity (GiB)   - required - the total memory of the Docker host.

Node is the Docker host and Container is the container name.

Usage:    python3 extract-ram-docker.py [--context CONTEXT] [--no-exec] [--debug]

Requires: the `docker` package (for example, pip install docker), and a Docker
          context with daemon access sufficient to list, inspect, exec into
          containers, and read host info.
"""

import argparse
import csv
import logging
import sys
import uuid
from datetime import datetime, timezone

import docker
from docker.context import ContextAPI

RUNID = str(uuid.uuid4())

# Shell run inside each container to read its cgroup peak in bytes.
CGROUP_SCRIPT = (
    'T=$(stat -fc %T /sys/fs/cgroup/ 2>/dev/null) || exit 1;'
    'if [ "$T" = "cgroup2fs" ]; then V=$(cat /sys/fs/cgroup/memory.peak 2>/dev/null);'
    'else V=$(cat /sys/fs/cgroup/memory/memory.max_usage_in_bytes 2>/dev/null); fi;'
    'printf "%s" "$V"'
)


def get_client(context_name):
    """A Docker client for the given context name, or the current context if None."""
    if not context_name:
        return docker.from_env()
    ctx = ContextAPI.get_context(context_name)
    if ctx is None:
        raise ValueError(f"Docker context {context_name!r} not found")
    return docker.DockerClient(base_url=ctx.Host)


def running_containers(client):
    """The running Docker containers. Aborts the script on failure."""
    try:
        return client.containers.list()
    except Exception as e:
        logging.error("Could not list running containers: %s; aborting.", e)
        sys.exit(1)


def cgroup_peak_gib(container):
    """Peak memory (GiB) from the container's cgroup, or None if unavailable."""
    try:
        exit_code, output = container.exec_run(["/bin/sh", "-c", CGROUP_SCRIPT])
    except Exception as e:
        logging.warning("cgroup peak: exec failed for %s: %s", container.name, e)
        return None

    out = output.decode().strip() if output else ""
    if exit_code != 0 or not out.isdigit():
        logging.debug("no cgroup peak reading for %s", container.name)
        return None
    return int(out) / (1024 ** 3)


def container_limit_gib(container):
    """The container's memory limit in GiB, or None if unlimited (0)."""
    limit = container.attrs.get("HostConfig", {}).get("Memory")
    return limit / (1024 ** 3) if limit else None


def host_info(client):
    """(host name, total memory GiB) from the Docker daemon; either may be None."""
    try:
        info = client.info()
    except Exception as e:
        logging.error("Could not read Docker host info: %s", e)
        return None, None
    name = info.get("Name")
    mem = info.get("MemTotal")
    cap = mem / (1024 ** 3) if isinstance(mem, int) else None
    return name, cap


def parse_args():
    parser = argparse.ArgumentParser(description="Sample RAM report for Docker deployments.")
    parser.add_argument("--context", help="Docker context to use (default: current context).")
    parser.add_argument(
        "--no-exec", action="store_true",
        help="Skip the cgroup peak reading (no exec into containers); report only the container limit and host capacity.",
    )
    parser.add_argument("--debug", action="store_true", help="Enable debug logging.")
    return parser.parse_args()


def main():
    args = parse_args()
    logging.basicConfig(level=logging.DEBUG if args.debug else logging.INFO)

    logging.info("Run %s", RUNID)

    try:
        client = get_client(args.context)
    except Exception as e:
        logging.error("Could not create Docker client: %s", e)
        sys.exit(1)

    containers = running_containers(client)
    logging.info("[1/3] Fetching running containers: %d found", len(containers))

    logging.info("[2/3] Checking host memory capacity")
    node, node_cap = host_info(client)
    if node_cap is None:
        logging.error("  could not determine host memory capacity; aborting.")
        sys.exit(1)
    logging.debug("  %s: memory capacity OK", node)

    logging.info(
        "[3/3] Checking memory for %d container(s)%s",
        len(containers), " (cgroup peak skipped, --no-exec)" if args.no_exec else "",
    )

    filename = f"ram-extract-{datetime.now(timezone.utc).strftime('%Y%m%dT%H%M%SZ')}.csv"
    rows = 0
    no_peak = 0
    with open(filename, "w", newline="") as f:
        writer = csv.writer(f)
        writer.writerow([
            "RunId", "Date/Time", "Node", "Container",
            "Cgroup Peak (GiB)", "Container Limit (GiB)", "Node Capacity (GiB)",
        ])

        for container in containers:
            datetime_str = datetime.now(timezone.utc).strftime("%Y-%m-%dT%H:%M:%SZ")
            if args.no_exec:
                cgroup = None
            else:
                cgroup = cgroup_peak_gib(container)
                if cgroup is None:
                    no_peak += 1
            limit = container_limit_gib(container)

            writer.writerow([
                RUNID, datetime_str, node if node is not None else "", container.name,
                cgroup if cgroup is not None else "",
                limit if limit is not None else "",
                node_cap if node_cap is not None else "",
            ])
            rows += 1

    logging.info("Wrote %d row(s) to %s (%d without a cgroup peak reading)", rows, filename, no_peak)
    if rows and no_peak == rows and not args.no_exec:
        logging.warning("No container returned a cgroup peak; check exec permissions and that the cgroup files are readable.")


if __name__ == "__main__":
    main()
Output
The script writes one row per container, with Node set to the Docker host. Memory values are in GiB, written as the script calculates them, without rounding. For example:
| RunId | Date/Time | Node | Container | Cgroup Peak (GiB) | Container Limit (GiB) | Node Capacity (GiB) |
|---|---|---|---|---|---|---|
ac481741-b48b-45a8-9f8d-064671127c7e |
2026-09-09T16:14:10Z |
ip-10-0-4-44 |
kx-db-sm |
0.11800003051757812 | 8.0 | 15.611419677734375 |
ac481741-b48b-45a8-9f8d-064671127c7e |
2026-09-09T16:14:10Z |
ip-10-0-4-44 |
kx-db-da |
0.3400001525878906 | 6.0 | 15.611419677734375 |
ac481741-b48b-45a8-9f8d-064671127c7e |
2026-09-09T16:14:10Z |
ip-10-0-4-44 |
kx-db-rt |
0.1829986572265625 | 0.5 | 15.611419677734375 |
ac481741-b48b-45a8-9f8d-064671127c7e |
2026-09-09T16:14:10Z |
ip-10-0-4-44 |
kx-db-agg |
0.09099960327148438 | 0.5 | 15.611419677734375 |
ac481741-b48b-45a8-9f8d-064671127c7e |
2026-09-09T16:14:11Z |
ip-10-0-4-44 |
kx-db-rc |
0.0449981689453125 | 0.5 | 15.611419677734375 |
ac481741-b48b-45a8-9f8d-064671127c7e |
2026-09-09T16:14:11Z |
ip-10-0-4-44 |
kx-db-gw |
0.5 | 15.611419677734375 |
FinSpace
In order to generate the reports to audit RAM capacity for FinSpace deployments, refer to the following links and example report generation.
AWS metrics
Retention periods
Amazon CloudWatch retains metric data as follows:
- Data points with a period of less than 60 seconds are available for 3 hours. These data points are high-resolution metrics and are available only for custom metrics that have been defined with a StorageResolution of 1
- Data points with a period of 60 seconds (1-minute) are available for 15 days
- Data points with a period of 300 seconds (5-minute) are available for 63 days
- Data points with a period of 3600 seconds (1 hour) are available for 455 days (15 months)
For further detail refer to Get Metric Statistics in the Amazon CloudWatch documentation.
Generate report
There are two steps required to generate a report:
Generate TSV file
Use the following commands to generate a TSV file licensing.tsv, in your /tmp directory.
Remember to set kx_start and kx_end variables to the correct dates for your reporting window.
#!/bin/bash
export kx_metric="MemoryUsageBytes"
export kx_start="2024-06-23T00:00:00"
export kx_end="2024-06-24T00:00:00"
export kx_period="300"
export kx_licfile="/tmp/licensing.tsv"
rm -f $kx_licfile
for cluster in $(aws cloudwatch list-metrics --namespace AWS/FinSpace --metric-name $kx_metric | jq '.Metrics[].Dimensions[] | select(.Name == "KxClusterId") | .Value'); do echo Running for $cluster ; echo $(aws cloudwatch get-metric-statistics --metric-name MemoryUsageBytes --start-time $kx_start --end-time $kx_end --period $kx_period --namespace AWS/FinSpace --statistics Average --dimensions Name="KxClusterId",Value=$cluster | jq -r --arg cluster $cluster '.Datapoints[] | [$cluster, .Timestamp, .Average, .Unit] | @tsv' >> $kx_licfile); done
Process TSV file
The following q commands process this TSV file into a format that can be saved and shared back to KX.
q)system"c 500 500"
q)period:0D00:00:01*"I"$getenv`kx_period
q)report:`ts xasc flip `cluster`ts`val`unit!("SPJS";"\t") 0: hsym`$getenv`kx_licfile
q)aggregate:select totalGB:(sum val)%1e9 by period xbar ts from report
q)aggregate

ts                           | totalGB
-----------------------------| -----------
2024.06.23D00:00:00.000000000| 42.35248
2024.06.23D00:05:00.000000000| 42.35249
2024.06.23D00:10:00.000000000| 42.35249
2024.06.23D00:15:00.000000000| 42.35249
2024.06.23D00:20:00.000000000| 42.35249
2024.06.23D00:25:00.000000000| 42.35249
2024.06.23D00:30:00.000000000| 42.3525
2024.06.23D00:35:00.000000000| 42.3525
2024.06.23D00:40:00.000000000| 42.35251
2024.06.23D00:45:00.000000000| 42.35251
2024.06.23D00:50:00.000000000| 42.35251
2024.06.23D00:55:00.000000000| 42.35251
2024.06.23D01:00:00.000000000| 42.35251
...

q)summary:select avg totalGB by 0D01 xbar ts from aggregate
q)summary
ts                           | totalGB
-----------------------------| -----------
2024.06.23D00:00:00.000000000| 42.3525
2024.06.23D01:00:00.000000000| 42.35253
2024.06.23D02:00:00.000000000| 42.35256
2024.06.23D03:00:00.000000000| 42.3526
2024.06.23D04:00:00.000000000| 42.35263
2024.06.23D05:00:00.000000000| 42.35266
2024.06.23D06:00:00.000000000| 42.35269
2024.06.23D07:00:00.000000000| 42.35273
2024.06.23D08:00:00.000000000| 42.35276
2024.06.23D09:00:00.000000000| 42.35279
2024.06.23D10:00:00.000000000| 42.35282
2024.06.23D11:00:00.000000000| 42.35286
2024.06.23D12:00:00.000000000| 42.35149
2024.06.23D13:00:00.000000000| 0.002702809
2024.06.23D14:00:00.000000000| 7.194445
2024.06.23D15:00:00.000000000| 0.0126699
2024.06.23D18:00:00.000000000| 0.002735492
...
summary_output_path:"/home/<your output path>/"
save `$summary_output_path,"summary.csv";
This CSV can now be shared with KX to report on FinSpace usage.