White paper
Data visualization with kdb+ using ODBC:
A Tableau case study
Business intelligence (BI) tools are widely used across many industries for their interactive nature, which enables users to create and customize dynamic data visualizations easily. KX provides its own visualization tool, Dashboards for KX, but clients might have incumbent solutions they wish to connect to kdb+.
Alternatively, many organizations might wish to migrate their back-end database to kdb+ for increased efficiency and scalability, while retaining their current visualization front end. This paper offers guidance.
Tableau is an example of a widely-used BI tool. This paper outlines how it can be used to access kdb+ via ODBC (Open Database Connectivity), a standard application-programming interface used to connect different database management systems, specifically designed to be independent of databases and operating systems. Version 3.4 of kdb+ included an updated version of its Windows ODBC driver (ODBCv3) to support wider access to kdb+ data.
This paper illustrates the flexibility with which kdb+ data can be accessed by Tableau using ODBC. It explains further how kdb+’s caching feature may be used to improve performance by optimizing repeated queries.
Keep in mind that there will always be limitations on third-party solutions not designed from the outset for processing real-time streaming data. KX’s own visualization tool Dashboards for KX is optimized for streaming queries and inherits functionality such as user management, load balancing, access control, caching and queuing from the underlying platform as well as direct access to q for comprehensive querying capabilities. Such features and their ability to support high-volume, low-latency access to streaming data cannot be assumed in third-party products.
Guidelines on connection, setup, queries and advice on how to maximize performance are discussed. For both new and existing users, this paper aims to reduce the learning curve, boost efficiency and increase usability when combining these two technologies.
All tests were run using kdb+ version 3.5 and Tableau 10.3.
Connecting to kdb+ using ODBC
Instructions on how to connect kdb+ from Tableau Desktop for both Windows and Linux can be found at Interfaces: Kdb+ server for ODBC3.
For an ODBC driver to connect to an application, it needs a DSN (Data Source Name). A DSN contains the name, directory and driver of the database, and (depending on the type of DSN) the access credentials of the user.
With administrator rights, adding a new DSN is relatively straightforward. See the instructions linked to above.
A second way to add a DSN does not require administrator access, and might be useful for some users. This defines the DSN connection details in a Registry file rather than adding new DSNs directly in the ODBC Data Source Administrator. This is an alternative to steps 3, 4 and 5 in the instructions linked to above.
-
Copy
qodbc.dllto the correct location. -
Define the Registry file and save it to
C:\Users\<username>with a.regextension. Here is an example of what the file might look like.Windows Registry Editor Version 5.00 [HKEY_CURRENT_USER\SOFTWARE\ODBC\ODBC.INI\DEV] "Driver"="P:\…\qodbc3\w64\qodbc3.dll" "Description"="KDB ODBC3 Driver" "HOST"="hostname:port" "UID"="username" "PWD"="password" [HKEY_CURRENT_USER\SOFTWARE\ODBC\ODBC.INI\ODBC Data Sources] "DEV"="KDB ODBC3 Driver" -
Double-click on the file when saved. This will create the correct driver entries, which for this example will be a new kdb+ DSN called
DEV.
This second method makes it easier to maintain and share connection details with multiple users, as the DSN details reside in a separate text file rather than in the Windows Registry.
Connecting to Tableau Desktop
Once a kdb+ DSN has been added, and the rest of the set-up instructions are followed, you are ready to connect to kdb+ from Tableau. On opening Tableau, you will be prompted to select the type of database you wish to connect to, select the option Other Databases (ODBC).
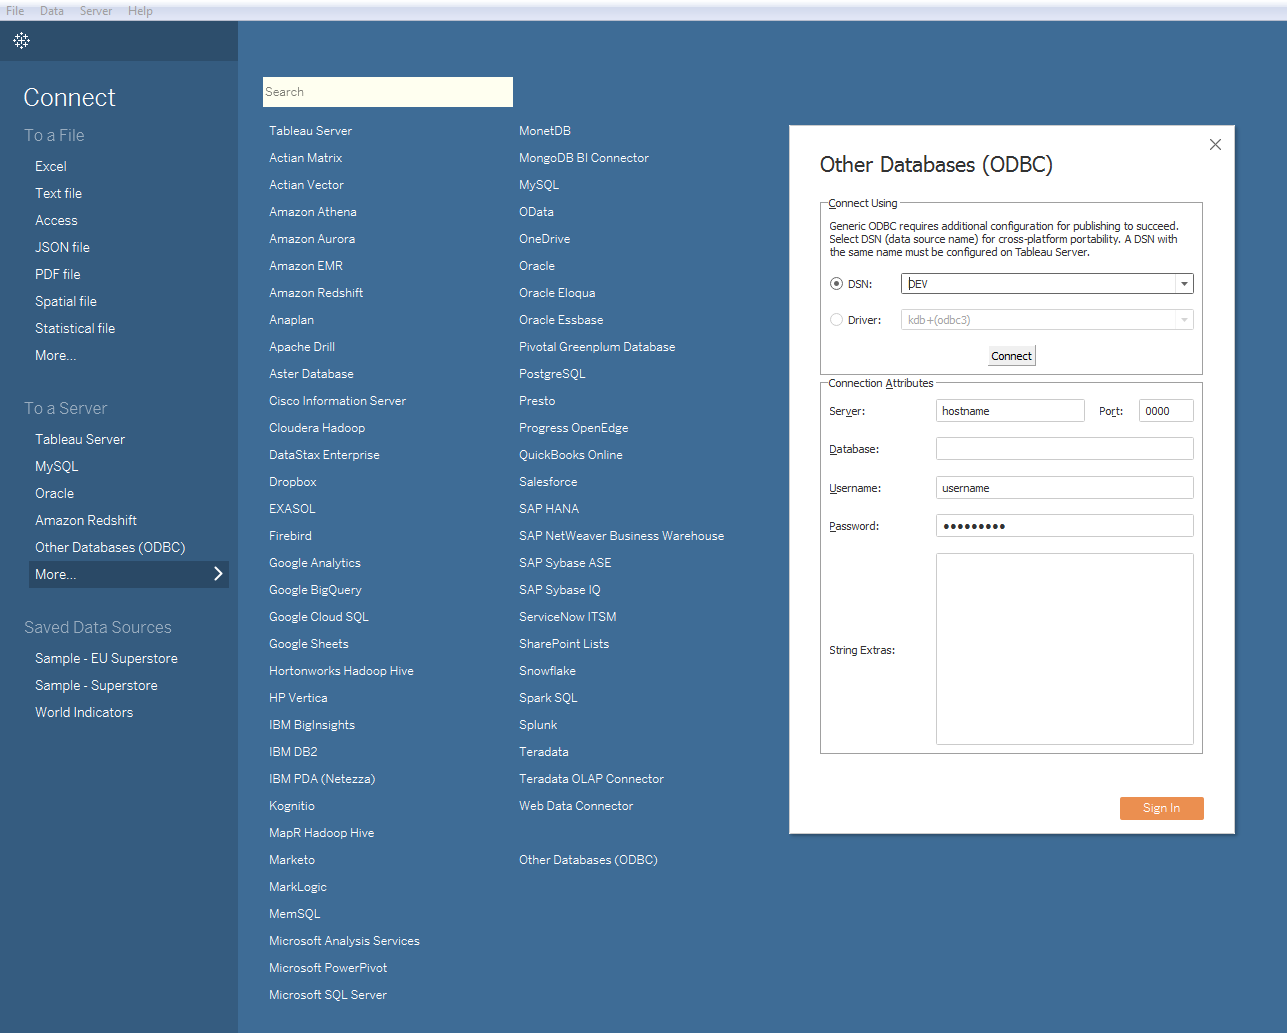
Next, select the correct DSN from the dropdown list and click Connect. This will automatically populate the Connection Attributes in the bottom half of the window using the details defined earlier in the Registry file. The final step is to click the Sign In button, which creates a connection to the kdb+ process, enabling the database to be queried via Tableau’s Custom SQL, as demonstrated in the following section.
Connecting to Tableau Server
The set-up instructions above, both explicit and linked, are specifically for a user connecting from Tableau Desktop. This is the local version of Tableau installed on a desktop or laptop. Tableau Server, on the other hand, is installed on a Windows server and is accessible to users via a browser. Tableau Server brings additional collaboration, security and scalability capabilities not available using only Tableau Desktop.
Tableau workbooks can be shared between both by publishing from Tableau Desktop to Tableau Server. This procedure is detailed in the section Publishing to Tableau Server.
To connect via Tableau Server, the Registry file that was presented in the previous section needs to be configured. This process may be handled by an organization’s support team, depending on the installation setup. The driver also needs to be installed, and then the connection can be initialized much as for Tableau Desktop.
Other considerations
Since a release on 2017.09.11, qodbc3 allows specification of connection details without a DSN. This means all details, except the password, will be saved by Tableau in a workbook or saved data source. However, this change only affects desktop users. Because the password is not embedded, the DSN is still required to be defined on the server as this is the only way the password will be picked up for published reports.
It is also important to note that connection details are embedded in both the Tableau workbook and the DSN definition. For version management, when sharing workbooks between developers or when publishing them to Tableau Server, this can become problematic. One workaround solution to manage this is to wipe these details from the workbook with a script before sharing or publishing workbooks. This concept is explored below in Publishing to Tableau Server.
Tableau functionality for kdb+
Calling q from Tableau
Once a successful connection has been made, the next step is to begin by
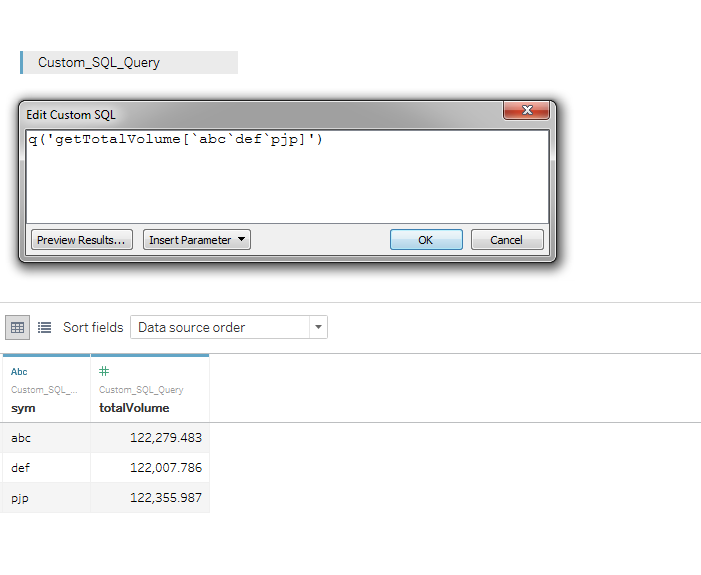
running some sample queries. Tableau’s Custom SQL is the method by which
q queries can be run from Tableau. In particular, the q() function can
be used to send synchronous queries to kdb+, as shown below.
To demonstrate this, define a table tab in the kdb+ process you are
connecting to.
q)N:8
q)dates:2018.03.28 + til 3
q)tab:([] date:N?dates;category:N?`CORP`EQ`GOV;volume:N?til 10000)
Then, in Tableau run the following in the Custom SQL.
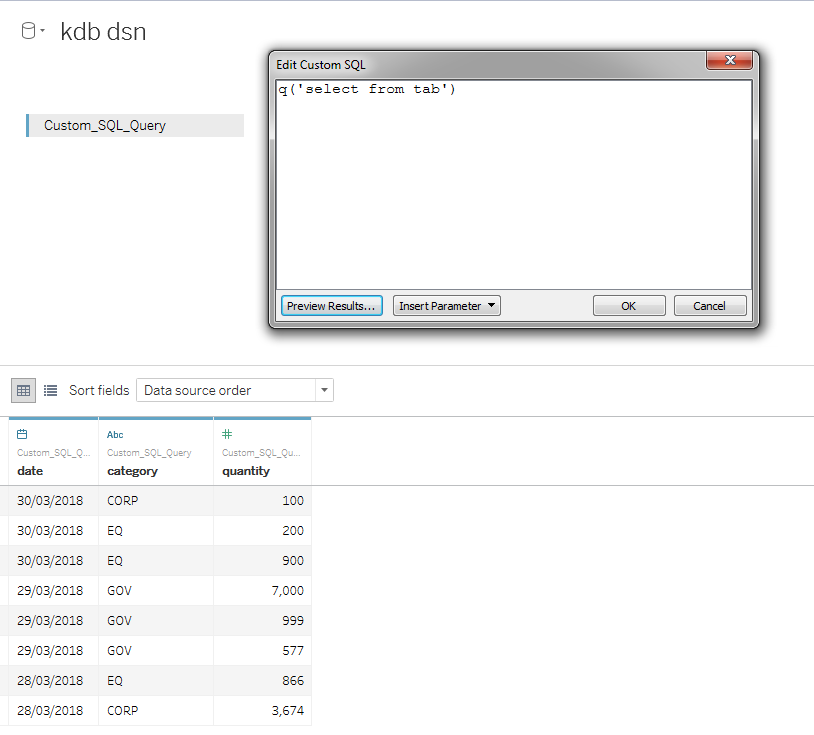
Now the data in the table tab is available for use in Tableau. Note
that if tab is a not a partitioned table (and is small enough to be
handled via SQL), you can just type its name into the table selector,
there is no need to use q('select from tab'). Other acceptable syntaxes
are:
q('tablename')
q('select from table where date in 2018.07.02')
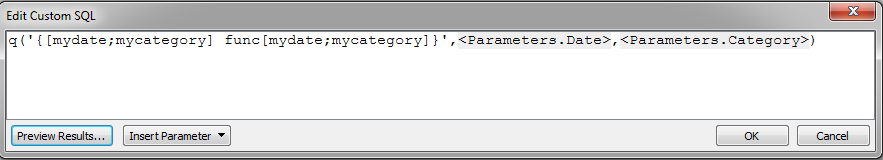
q('function',<Parameters.Date>)
q('{[mydate] func[…]}',<Parameters.Date>)Queries can be a simple select statement or can become much more complex and flexible using inbuilt parameters supplied by Tableau, which will be demonstrated in the next section.
Known SQL compatibility issues
- SQL string literals are trimmed like q symbols
MIN()andMAX()don’t work on strings- q strings and booleans lack nulls, therefore SQL operations on null data resulting in these types ‘erase’ nulls
COUNTandCOUNT DISTINCTdon’t ignore nulls- SQL selects from partitioned tables are not supported – one should pre-select from a partitioned table using the
q()function instead
Datatypes
Tableau caters for multiple q datatypes.
| Tableau | q |
|---|---|
| String | Symbol, String |
| Date | Date |
| Date & Time | Timestamp |
| Numerical | Int, float |
| Boolean | Boolean |
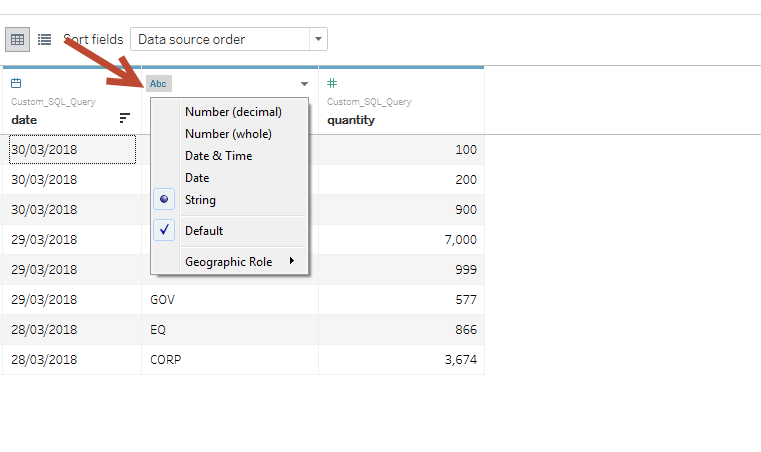
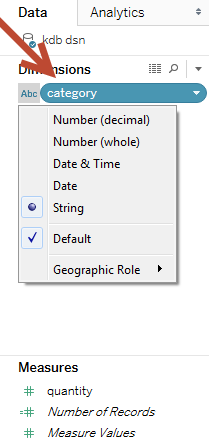
On loading data, Tableau automatically interprets the datatype of a field. It is recommended that the user checks these have been interpreted correctly after the data is loaded. If it is incorrect, the datatype can then be easily changed on the Data Source page or in the Data pane as shown below.
Simple parameters
Tableau parameters provide further flexibility when working with q
functions. To demonstrate, define a function func that selects from
the table tab defined above. This function can be
called from Tableau using Tableau-defined parameters.
func:{[mydate;mycategory]
  select from tab where date in mydate, category in mycategory
  };
Take the parameter mycategory: in this example, a list of allowable
symbols that are acceptable for the parameter mycategory can be
defined in Tableau.
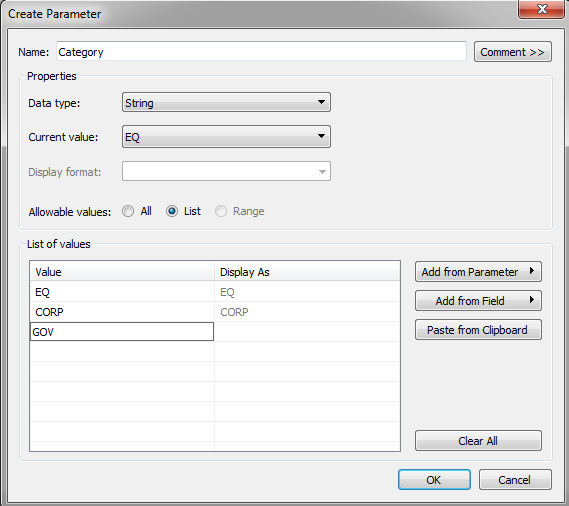
This can be done in the Custom SQL stage when you are writing your query. These parameters can then be shown and made available for users as a dropdown list on worksheets and dashboards as can be seen below.
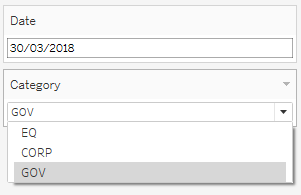
Tableau parameters are limited to static values, and a single select option when placed in a view. However, there are ways to make them more dynamic and flexible. This will be explored below in Dynamic Parameters.
Tableau filters
As shown above, parameters are a useful tool for creating user-defined inputs to visualizations. However, there are cases where the user may want to return the entire data set first and only afterwards reduce the data set. This can be achieved using Tableau’s filters.
Tableau Category Parameter as defined in the previous section
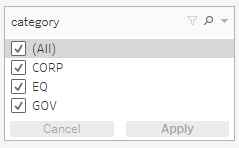
Tableau Category Filter
Filters are the standard way to reduce the set of data displayed on a worksheet. Note from the above screenshots that filters are not limited to a single select option as parameters are.
Filters are most effective with fast queries on small datasets. For longer queries and/or larger datasets, filters become challenging from a performance point of view. This is because every time a filter selection is changed, the Custom SQL query runs the same query multiple times per view to build dimensions. Therefore the more filters and dimensions you add to a view, the slower performance becomes.
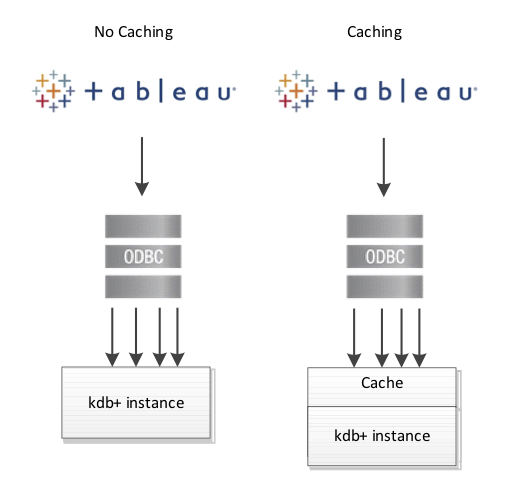
Caching
One way to get around this inefficiency is to introduce caching in kdb+. Caching is storing results from previous queries or calculations in an internal lookup table (or cache) for faster data retrieval on subsequent queries. Caching here is being used to address the problem of filters causing queries to be re-run.
The following example demonstrates the performance improvement of
caching when incorporated into a simple q function, getTotalVolume
(below), which extracts the total volume by symbol from a table t.
The demonstration table t contains randomly-generated mock data of symbol and volume values.
N:100000000;
t:([] sym:N?`3;volume:N?10.0);
// Function used to compute the total volume by symbol from the table t
getTotalVolume:{[syms]
  select totalVolume:sum volume by sym from t where sym in syms
  };
Below is sample output of this function when called from Tableau. Query response times for an increasing number of symbols runs from hundreds of milliseconds to seconds:
| number of symbols | time |
|---|---|
| 1,000,000 | 13 ms |
| 10,000,000 | 120 ms |
| 100,000,000 | 1038 ms |
To incorporate caching, the existing function can be modified to store
the total volume result for each queried symbol in a keyed table, called
volumeCache. Whenever the function is called from Tableau, an
internal lookup is performed on the volumeCache table to determine
if the calculation for the requested symbol has already been performed.
If so, the result can be immediately returned, otherwise a calculation
against the table t is performed.
volumeCache:([sym:`u#`symbol$()];totalVolume:`float$())
getTotalVolume:{[syms]
  if[-11h~type syms;syms:enlist syms];
  // Get the list of syms which contain entries in the volumeCache
  // Extract the totalVolume values for those symbols
  if[count preCalculated:([]sym:syms) inter key[volumeCache];
     result:select from volumeCache where ([]sym) in preCalculated
  ];
  // If all syms are contained in the volumeCache then return result
  if[not count notPreCalculated:([]sym:syms) except key[volumeCache];
    :result
  ];
  // For syms not present in volumeCache, perform lookup
  result,:newEntries:select totalVolume:sum volume by sym from t where
    ([]sym) in notPreCalculated;
  // upsert new results to volumeCache
  upsert[`volumeCache;newEntries];
  result
  };
Tableau queries against this modified function are significantly faster
and become sub-millisecond when symbols are already present within the
volumeCache. This approach greatly reduces the effect of filtering previously highlighted:
| number of symbols | time (1st query) | time (2nd query) |
|---|---|---|
| 1,000,000 | 3 ms | <0ms |
| 10,000,000 | 96 ms | <0ms |
| 100,000,000 | 1021 ms | <0ms |
Dynamic parameters
As mentioned above in Simple parameters, Tableau parameters are limited to static values, and a single select option when placed in a view. However, there are a number of ways to make parameters smarter, and can increase their usability and flexibility. Below, two such methods are described.
Predefining parameter options in a q function
From the previous example, the input parameter Category is limited to
single values. This can be made more flexible by
defining in the function a range of acceptable values.
In the example below, the
argument `all leads to a select with no restriction on category.
func:{[mydate;mycategory]
$[mycategory=`all;
select from tab where date in mydate;
select from tab where date in mydate, category in mycategory]
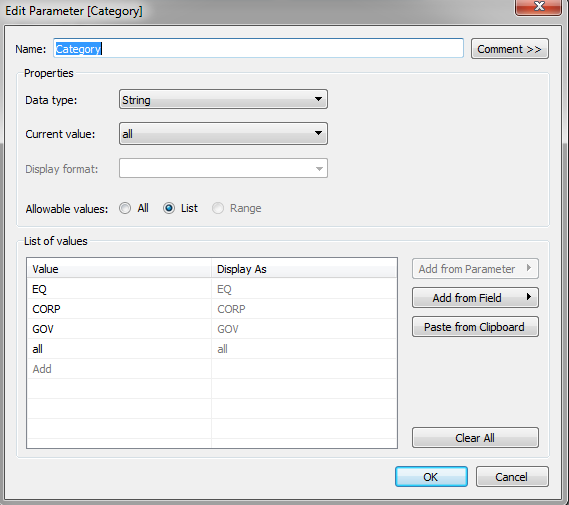
};Then all can be added to the list of predefined values in Tableau’s
definition of Category:
Using parameters with calculated fields
Using parameters in conjunction with Tableau’s calculated-field functionality can be a convenient and flexible tool in calculations as well as graphical representation. This is useful when the output the user wants to see is dependent on an input parameter, and a field needs to be adjusted accordingly.
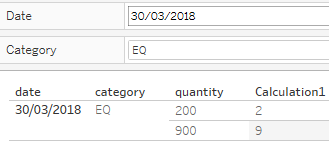
For example, in the user-defined Calculation1 logic below, the quantity
field will be divided by a different amount depending on the chosen
Category value.
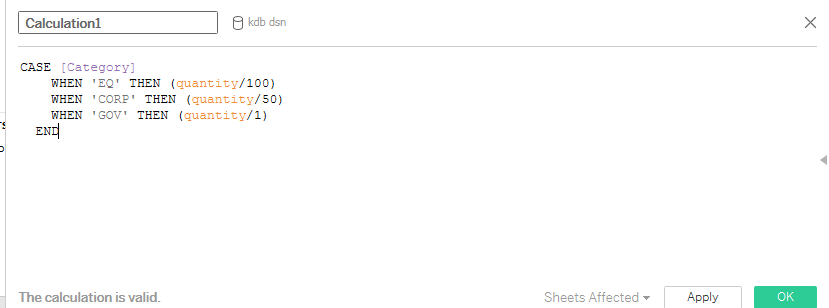
Below is sample output from when the user selects
a Category value of EQ.
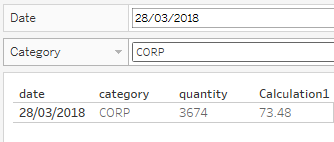
In contrast, when the user selects CORP the calculated field will be
divided by 50.
Multiple data sources
Kdb+ is efficient at joining data sets, and can easily do so in memory at the gateway level. However, it is also worth noting that it is possible to join two or more different datasets in Tableau if they share a common dimension or key. This can be useful when it is desirable to join certain datasets for reporting purposes only.
Tableau maintains connections to multiple data sources via a number of open live connections to a q instance. This functionality makes it possible to use the results from one data source to filter another. So far, in this paper, the examples have described functionality using only one data source. For the rest of this section, working with multiple data sources and joining them in Tableau will be explored.
One of the first things to note is that fields from different data sources can be included on the same worksheet, provided the sources are mapped to each other. In Tableau, fields from different data sources can be mapped to each other even if they have a different name, so long as they are the same datatype. This can be controlled and edited in Data > Edit Relationships.
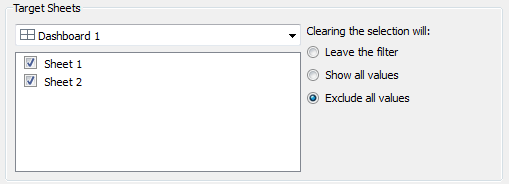
Actions
Once a dashboard is created, the filters are controlled in Dashboard >
Actions. When setting up actions for kdb+ data sources, it is important
to note how the selection is cleared. For large datasets, it is
recommended that you select the action Exclude all values. This
feature prevents data from being displayed in Sheet 2 until data is
first selected in Sheet 1. This has a very significant effect on
performance as it means Tableau only builds dimensions for views within
the dataset that has been filtered.
The following example demonstrates how much of an improvement on
performance this feature can have. Once a table t is defined and
subsequently called from Tableau, the next step is to create a
dashboard.
q) N:10000000
q) t:([] sym:N?`3;volume:N?10.0)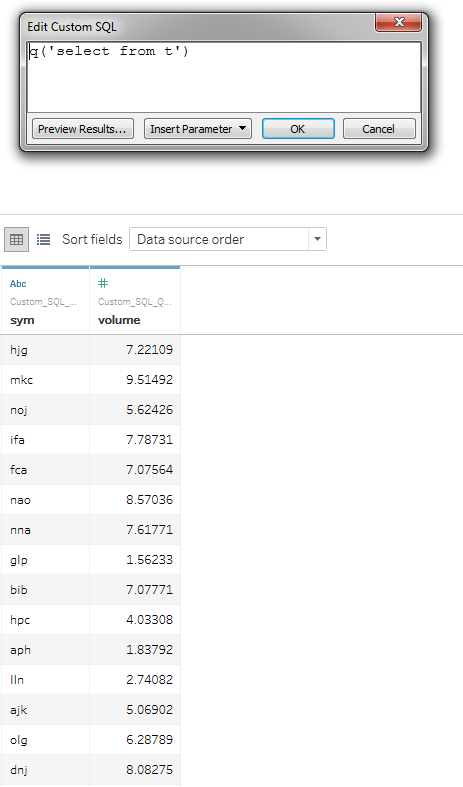
Step-by-step instructions on how to build the dashboard shown below and performance tests can be found in Appendix A.
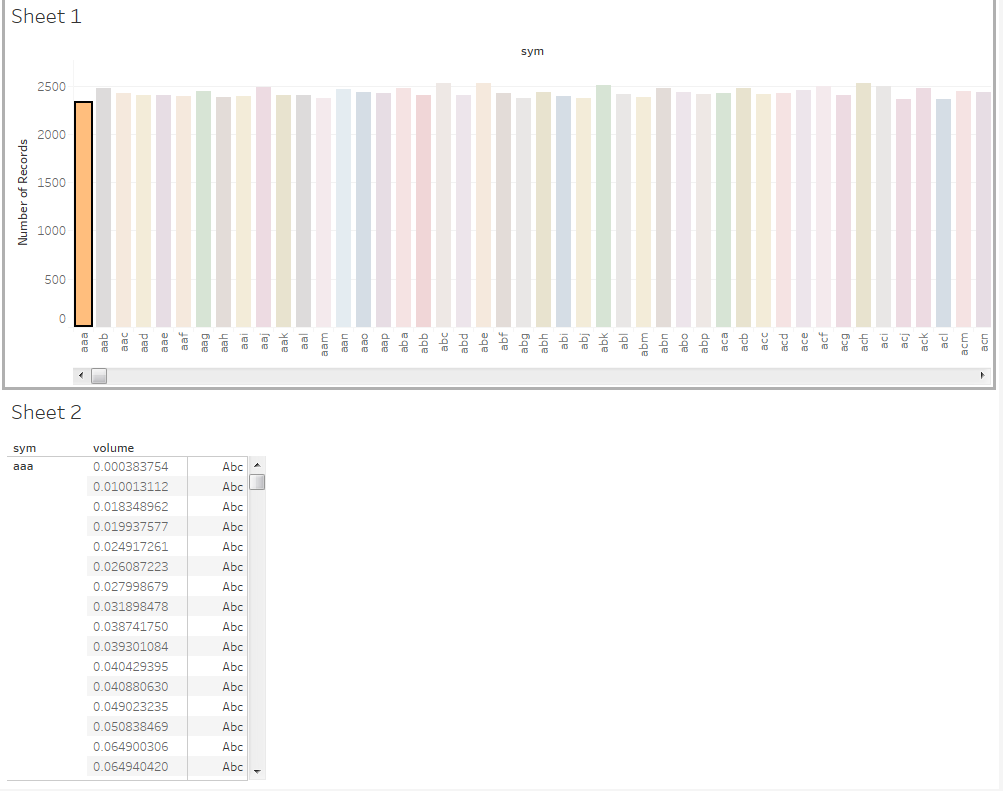
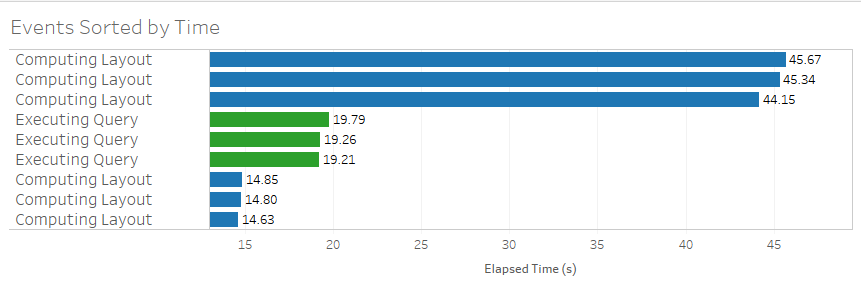
Action Selection: Show all values
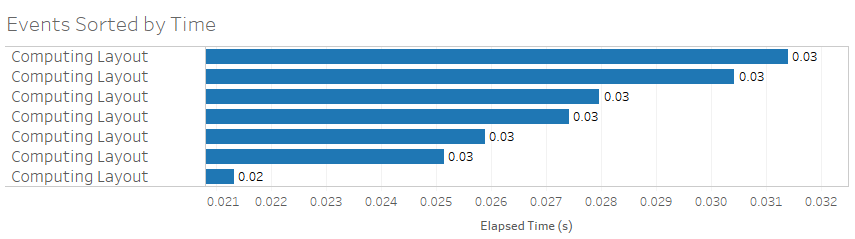
Action Selection: Exclude all values
Using the Exclude all values option yields a clear performance improvement. Computing time reduces from ~45secs per select/deselect down to ~0.3ms. Also, when using Exclude all values there is no Executing Query time.
Exploiting this feature can be hugely useful when working with kdb+ and Tableau where the volume of datasets can be very large.
Publishing to Tableau Server
As mentioned above, to share workbooks between Tableau Desktop and Tableau Server you can publish the former to the latter. Tableau provides detailed documentation and instructions on the general publishing procedure, which involves publishing from within an already-open workbook.
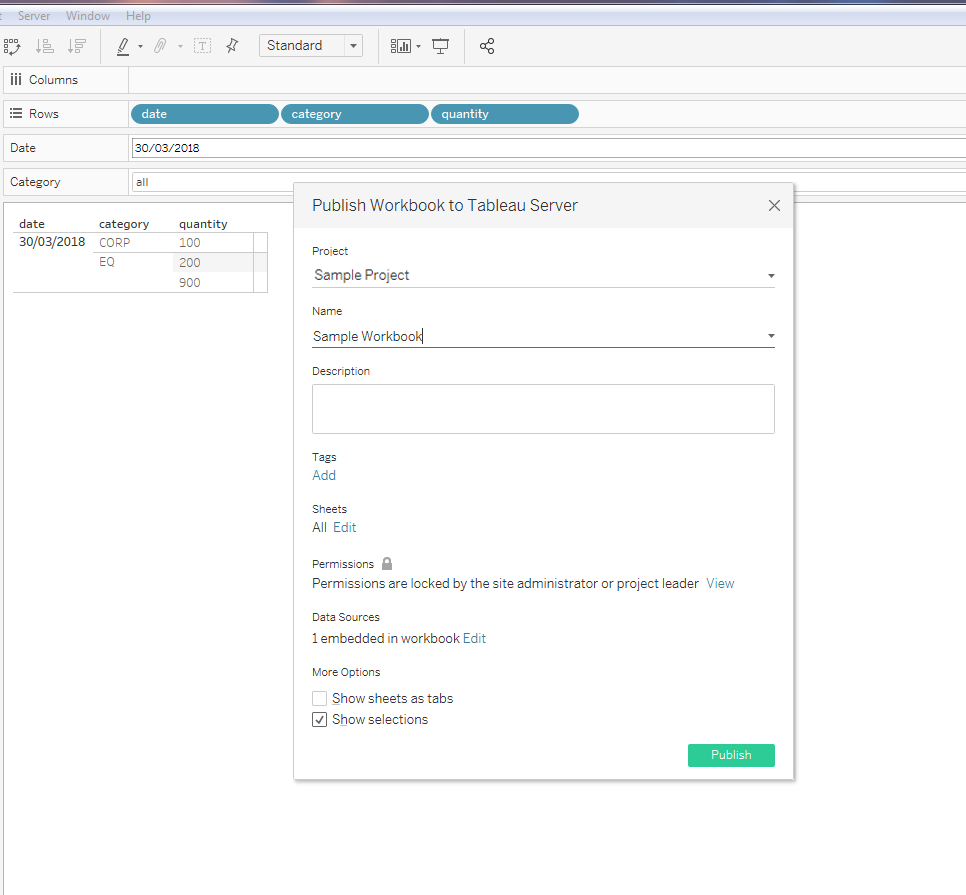
This is not an ideal way to publish workbooks that are connected to a kdb+ database, because connection details are stored within the workbook itself. Take the following scenario:
- A workbook has been developed in Tableau Desktop and is ready to share to the
Testingpartition in Tableau Server. - Throughout development, a development DSN has been used. But the workbook needs to be published to a UAT DSN.
- So the DSN details need to be changed to the UAT DSN before publication.
- The workbook again needs to be promoted, this time to the
Productionpartition. - The workbook must be reopened, and the DSN details changed to the production DSN, before final promotion to
Production.
This process is manual and prone to errors. For kdb+
connections, it is recommended to use the tabcmd command-line utility
which, among other things, enables the user to publish to Tableau Server
from the command line. This utility allows the user to deploy sheets
programmatically, streamlining the process hugely. It also means that as
part of the deploy procedure, the workbook can be edited by a script
before publishing via tabcmd. This means you can do some efficient
things like:
- Wipe out the connection details that are automatically embedded in the workbook
- Pick which DSN to point to, e.g.
DEV,UAT,QA,Prod - Pick which Tableau server to publish e.g.
tableau.netortableau-uat.net - Pick which Tableau environment to publish to e.g.
Development,TestingorProduction - Edit the Tableau project name
Using tabcmd and a script to edit the workbook can be an effective
way to make the publishing process smoother when connecting to
kdb+, especially when scaling use cases and looking to publish across
multiple environments and DSNs.
Conclusion
Kdb+ is well known as the world’s fastest time-series database. KX’s own visualization tool, Dashboards for KX, is optimized for this technology. However, kdb+ is flexible enough to connect with a range of different visualization tools. This white paper demonstrates how to connect to one such visualization tool, Tableau, by means of the KX ODBC driver.
You have seen how to set up a connection between kdb+ and Tableau using ODBC, with detailed instructions on how best to use Tableau’s query functionality, datatypes, parameters and filters with the q language.
The key takeaways include how kdb+’s caching feature may be used to improve performance by optimizing repeated queries from Tableau. Further to this, improving performance when using filters with multiple data sources was explored. The methods provided in this paper demonstrate that kdb+ and Tableau can be combined in an efficient way despite limitations that occur when combining the two technologies.
If the question is “Is Tableau the best, and best performing visualization tool when combining with kdb+?”, the answer is “No. There are other visualization tools better tailored to the kdb+ technology, for example KX’s visualization solution Dashboards for KX.” But if the question is “Can you combine these two technologies in an effective way?” the answer is “Yes”, and by applying the functionality described in this paper to work around limitations, to connect a Tableau visualization front-end to a kdb+ back end.
Author

Michaela Woods is a KX Technical Evangelist and Training Manager. She pioneered combining kdb+ with Tableau, transforming the data-visualization platform for a Tier-1 Investment Bank.
Appendix A
-
Create
Sheet 1-
Drag and drop
symto Columns. -
Drag and drop
Number of Recordsto Rows. -
Drag and drop
volumeto the Marks pane on color. Right-click and pick Discrete.
-
-
Create
Sheet 2-
Drag and drop
symto Rows. -
Drag and drop
volumeto Rows. Right-click and pick both Dimension and Discrete. This means every row will be displayed and not just the summed value.
-
-
Create
Dashboard 1-
Drag
Sheet 1onto the top of the dashboard. -
Drag
Sheet 2onto the bottom of the dashboard.
-
-
Make
Sheet 1a filter forSheet 2on the dashboard.- Hover over
Sheet 1and on the top right-hand side select the middle icon that looks like a filter.
- Hover over
-
Testing performance with default filter selection
-
Pick Help > Settings and Performance > Start Performance Recording
-
Select and deselect some of the bars in the top graph. You should notice much slower performance on deselect.
-
Pick Help > Settings and Performance > Stop Performance Recording
A performance workbook will then pop up, and you can analyze the performance.
-
-
Testing performance with selection Exclude all values
-
Pick Dashboard > Actions > Edit > Select 'Exclude all values'
-
Repeat step 5
A second performance workbook will pop up and can be compared with the previous one to analyze performance.
-